gcx — Grafana CLI
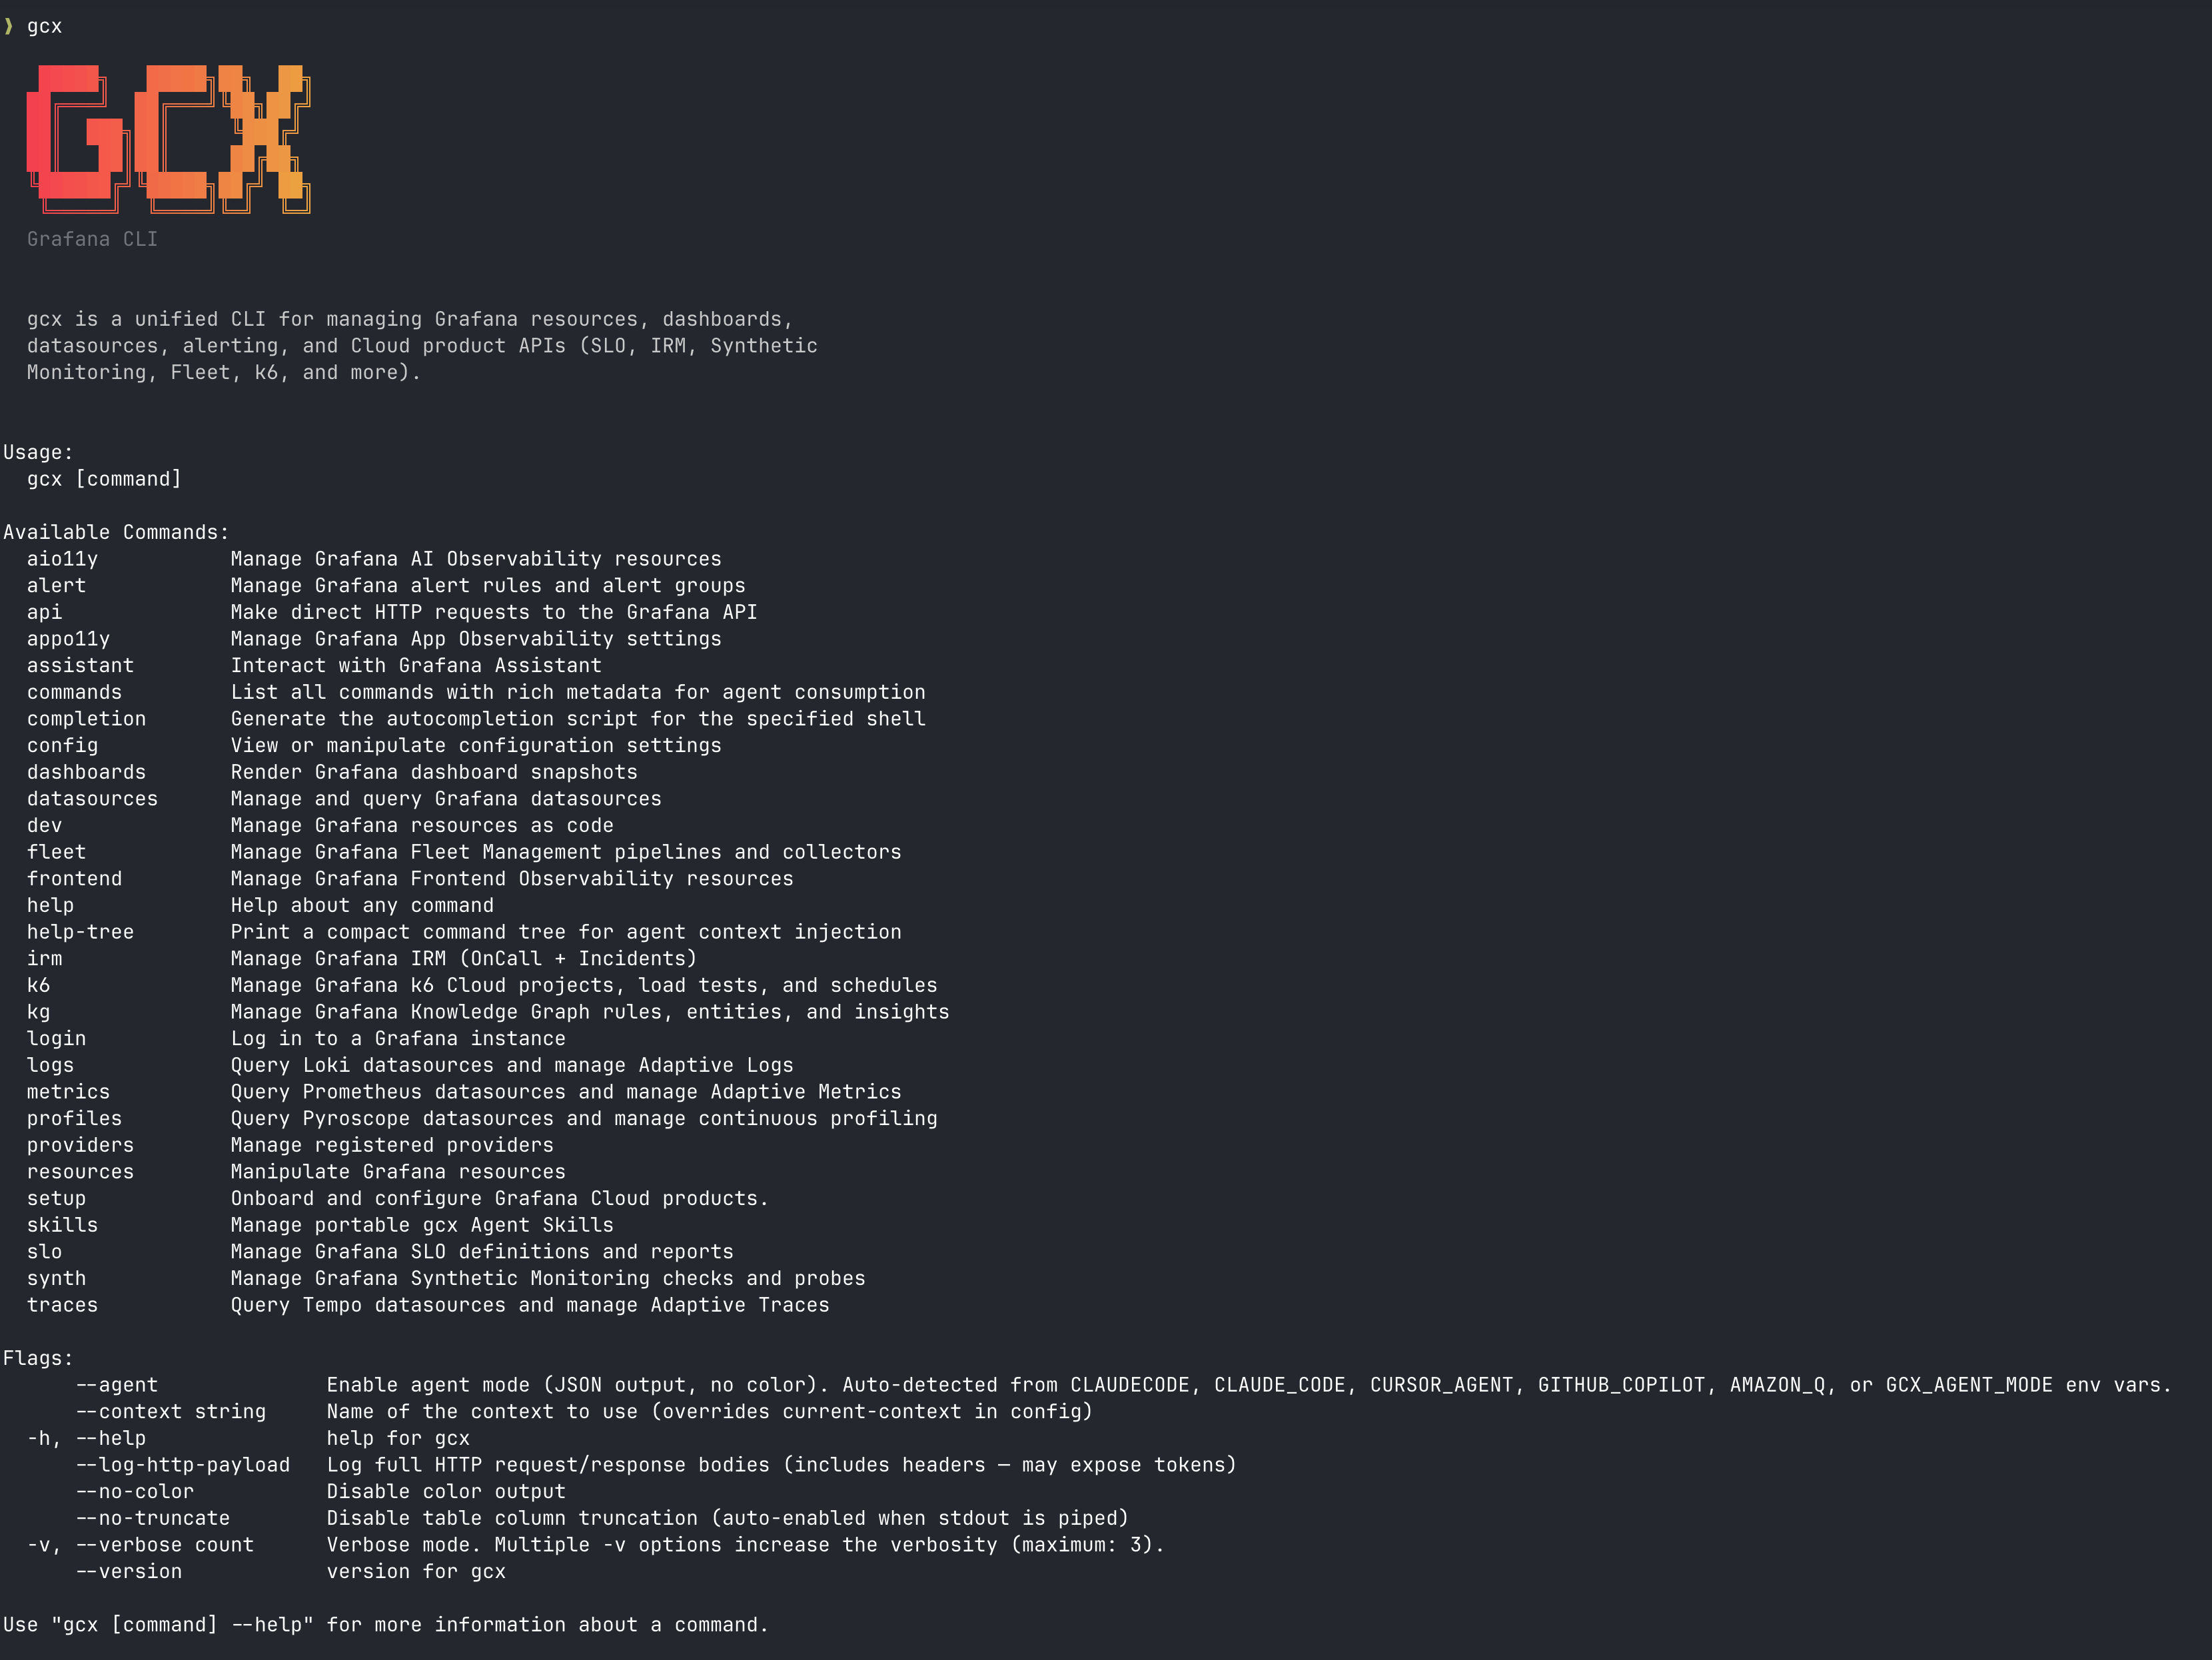
Grafana — in your terminal and your agentic coding environment. gcx works with Grafana Cloud, Enterprise, and OSS (Grafana 12+). See the compatibility matrix for details.
Query production. Investigate alerts. Let the Assistant root-cause issues. Ship fixes with observability built in. Without leaving your editor.
"Don't guess. Check the actual production data."
What is gcx?
gcx is a CLI for Grafana — Cloud, Enterprise, and OSS alike. It gives you and your AI coding agent structured access to your Grafana instance: dashboards, alerts, SLOs, metrics, logs, traces, and more. Core features (resources, alerting, signal queries) work on any Grafana 12+; Grafana Cloud adds product-specific commands on top.
gcx works with any agentic coding tool. It ships with a suite of agent skills for common workflows like alert investigation, dashboard creation and GitOps, SLO management, and observability setup - ready to use out of the box.
Contributing a new Grafana domain capability to gcx? Ask your coding agent to
use integrate-with-gcx
before choosing a command, provider, or datasource path.
Quick Start
# For Grafana Cloud instances
gcx login prod --server https://<your-cloud-instance>.grafana.net  # select oauth, then press Enter to skip cloud token selection

# For self-hosted Grafana instances
gcx login local --server http://localhost:3000 --token <token>

# check how busy your API routes are (works on any Grafana)
gcx metrics query 'sum by (handler)(rate(grafana_http_request_duration_seconds_count[5m]))' --since 1h

# check your grafana cloud metrics usage in the last day (Grafana Cloud only)
gcx metrics query -d grafanacloud-usage 'grafanacloud_org_metrics_billable_series'  --since 24h  --step 1h

# list and search your dashboards
gcx dashboards list
gcx dashboards search "node exporter"

# render a dashboard, allowing up to three minutes for the render
gcx dashboards snapshot my-dashboard --timeout 3m
Installation
Quick install (Linux/macOS):
curl -fsSL https://raw.githubusercontent.com/grafana/gcx/main/scripts/install.sh | sh
Downloads the latest release, verifies the SHA-256 checksum, and installs to
~/.local/bin. Override the location with GCX_INSTALL_DIR:
curl -fsSL https://raw.githubusercontent.com/grafana/gcx/main/scripts/install.sh | GCX_INSTALL_DIR=/usr/local/bin sh
To upgrade, run the same command again, then check gcx --version. If the
version does not change, you have a second gcx earlier in your PATH — run
which -a gcx and see
The version does not change after an upgrade.
Homebrew (macOS and Linux):
brew install gcx
Installs the gcx formula from homebrew-core. Homebrew has a prebuilt bottle
for macOS and Linux, so the install takes seconds and needs no tap.
To update to the latest version:
brew update && brew upgrade gcx
The Grafana tap also carries gcx. Use it if you want Homebrew to compile the
binary on your machine:
brew install grafana/grafana/gcx
That build needs Homebrew's go, which Homebrew installs as a build
dependency. The first install takes 30–60 seconds while Go fetches
dependencies.
Pre-built binary (Linux/macOS/Windows):
Download the latest archive for your OS and architecture from the
releases page,
extract it, and move the binary to your PATH:
tar xzf gcx_*.tar.gz
chmod +x gcx && sudo mv gcx /usr/local/bin/
On macOS, the manually-downloaded binary may be blocked on first run with
"Apple could not verify…" or killed: 9 — see
macOS Gatekeeper and killed: 9
for the one-time workaround. The curl | sh installer above handles this
automatically.
Go install:
go install github.com/grafana/gcx/cmd/gcx@latest
Shell completion:
gcx completion zsh > "${fpath[1]}/_gcx"   # zsh
gcx completion bash > /etc/bash_completion.d/gcx  # bash
gcx completion fish > ~/.config/fish/completions/gcx.fish  # fish
Verify: gcx --version
Authentication
gcx login creates or re-authenticates a context. It auto-detects whether the server is Grafana Cloud (*.grafana.net) or on-premises and adjusts the prompt accordingly. Pick the path below that matches your setup.
Grafana Cloud, browser-based OAuth (interactive, recommended):
gcx login my-stack --server https://my-stack.grafana.net
Opens a browser for OAuth, then saves the access token, refresh token, and proxy endpoint to the my-stack context's named stack entry and makes the context current. Best for day-to-day use on Cloud stacks. If OAuth doesn't suit your setup, pick "Service account token" at the prompt.
gcx stops before the browser flow when the current process cannot write to the
OS credential store. Agent users must approve the same command outside the
sandbox. See Keychain credential storage.
Service account token (Cloud or on-premises, recommended for CI/automation):
gcx login my-grafana --server https://your-instance.grafana.net --token glsa_xxx --yes
Use a Grafana service account token with a role matching what the token needs to do: Viewer is enough for querying (metrics, logs, traces, profiles) and reading dashboards or folders; Editor covers pushing and editing dashboards and folders; managing datasource configuration needs Admin. On Grafana Cloud and Enterprise, RBAC custom roles can scope query access tighter (for example datasources:read plus datasources:query on specific datasources). Tokens work for both Cloud and on-premises and are recommended for automation. On-premises stacks can also use basic authentication or configured mTLS client certificates.
Grafana Cloud product APIs (SLO, Synthetic Monitoring, IRM, etc.):
Cloud product commands need a separate Grafana Cloud platform credential in
addition to Grafana instance auth. A
Cloud Access Policy token
has the widest command compatibility and is recommended for automation. Provide
one at login:
gcx login my-stack --server https://my-stack.grafana.net --token glsa_xxx --cloud-token glc_xxx --yes
Or add Cloud access later by re-running gcx login against the same context.
The interactive Cloud step can keep the existing CAP or unexpired OAuth
credential, accept a new CAP, run the experimental browser-based Cloud OAuth
flow, or skip Cloud functionality:
gcx login --context my-stack
You can also run the Cloud OAuth flow directly:
gcx cloud login --context my-stack
Direct Cloud OAuth stores the OAuth token, expiry, granted scopes, and endpoint
pair, but it is experimental and not every Cloud product command supports it
yet. Use a CAP for full compatibility.
gcx derives the Cloud stack slug from --server when possible. Set it explicitly only for custom domains where gcx cannot derive it:
gcx config set stacks.my-stack.slug your-stack-slug
You do not need to set Cloud endpoints for grafana.com; gcx defaults to
https://grafana.com. For a custom environment, authenticate and store a
coherent OAuth/API destination pair: supplying one endpoint to a login command
uses it for both operations unless you explicitly supply both to
gcx cloud login. Changing a named entry's api-url or oauth-url invalidates
its old credential, so re-authenticate after the edit.
Environment variables (CI/CD, agents):
export GRAFANA_SERVER="https://your-instance.grafana.net"
export GRAFANA_TOKEN="your-service-account-token"
export GRAFANA_CLOUD_TOKEN="your-cloud-access-policy-token"

# Optional: only needed if gcx cannot derive the stack slug from GRAFANA_SERVER.
export GRAFANA_CLOUD_STACK="your-stack-slug"
Env vars resolve at every command invocation, so you can run gcx commands directly without a prior gcx login.
For safety, an auto-discovered repository .gcx.yaml cannot attach runtime
tokens, prompted login credentials, or external mTLS keypairs to destinations
the file supplies. If you intend that file to own credentials or direct
provider endpoints, authorize it explicitly with --config .gcx.yaml or
GCX_CONFIG=.gcx.yaml; a --server or endpoint flag alone is not sufficient.
Provider-specific runtime endpoints are accepted only when their matching
runtime credential is supplied in the same invocation; that pair does not
authorize an auto-discovered repository stack's TLS or proxy configuration.
Verify: gcx config check
See the login reference for the full guide, including re-authentication, environment-variable setup, and troubleshooting for common errors.
See It in Action
Query production from your terminal:
$ gcx metrics query 'sum by (instance)(rate(grafana_http_request_duration_seconds_count[5m]))' --since 1h
┌───────────────────────────────────────────┬───────────────────────────────────────────┬───────────────────────────────────────────┐
│ INSTANCE                                  │ TIMESTAMP                                 │ VALUE                                     │
├───────────────────────────────────────────┼───────────────────────────────────────────┼───────────────────────────────────────────┤
│ localhost:3000                            │ 2026-04-28T11:59:00+01:00                 │ 0.0073020555555555556                     │
│ localhost:3000                            │ 2026-04-28T12:00:00+01:00                 │ 0.11167158333333332                       │
│ localhost:3000                            │ 2026-04-28T12:01:00+01:00                 │ 0.1024372962962963                        │
│ localhost:3000                            │ 2026-04-28T12:02:00+01:00                 │ 0.09583333333333333                       │
...
Check what's firing:





 @grafana