debug-that
Debugger CLI built for AI agents. Fast, token-efficient, no fluff.
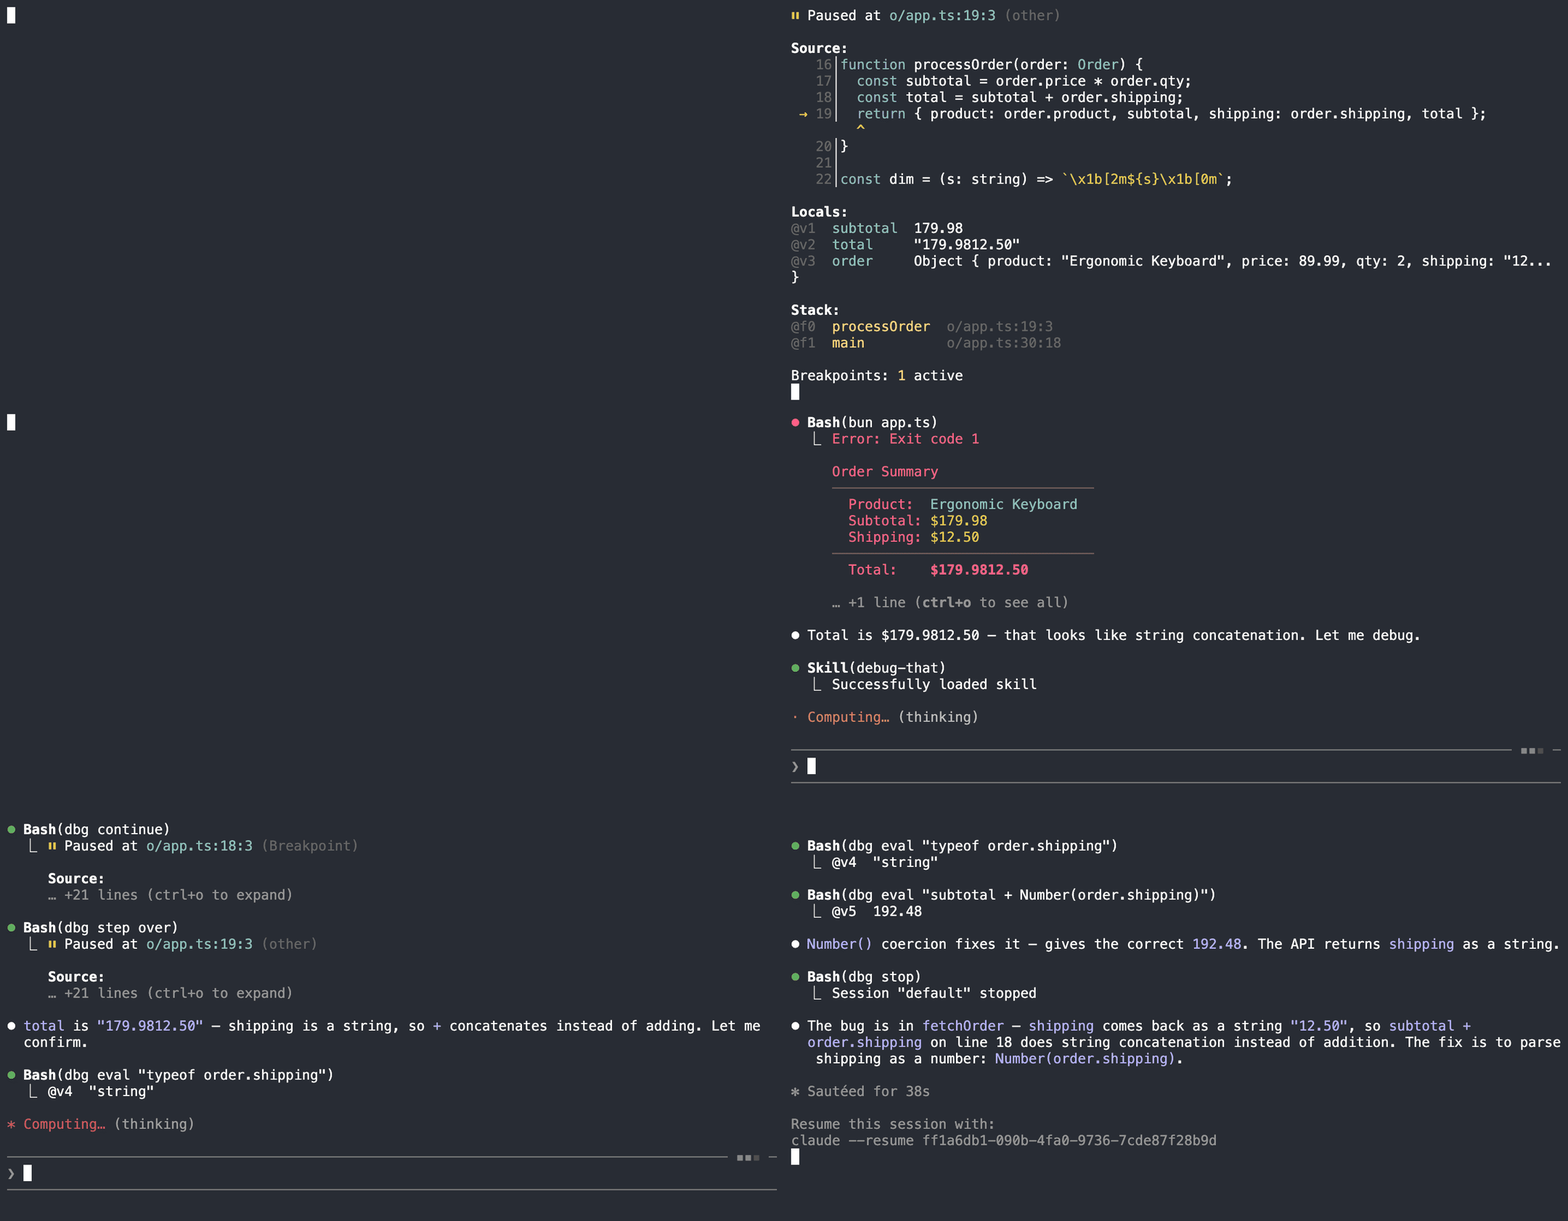
Why? Agents waste tokens on print-debugging. A real debugger gives precise state inspection in minimal output — variables, stack, breakpoints — all via short @ref handles.
Inspired by Vercel's agent-browser CLI — the same @ref concept, applied to debugging instead of browsing.
Supported Runtimes & Languages
| Runtime | Language | Status | Protocol |
|---|
| Node.js | JavaScript | Supported | V8 Inspector (CDP) |
| Node.js + tsx/ts-node | TypeScript | Supported | V8 Inspector (CDP) + Source Maps |
| Bun | JavaScript / TypeScript | Supported | WebKit Inspector (JSC) |
| LLDB | C / C++ / Rust / Swift | Supported | DAP (Debug Adapter Protocol) |
| Deno | JavaScript / TypeScript | Planned | V8 Inspector (CDP) |
| Python (debugpy) | Python | Supported | DAP |
| Go (delve) | Go | Planned | DAP |
| Java (JDWP) | Java / Kotlin | Planned | DAP |
dbg auto-detects the runtime from the launch command and uses the appropriate protocol adapter. For native languages, use --runtime lldb to select the DAP adapter.
Install
Requires Bun.
bun install --global debug-that
npx skills add theodo-group/debug-that
Example
> dbg launch --brk tsx src/app.ts
Session "default" started (pid 70445)
Paused at ./src/app.ts:0:1

> dbg break src/app.ts:19
BP#1 set at src/app.ts:19

> dbg continue
Paused at ./src/app.ts:19:21 (breakpoint)

Source:
   16|
   17|const alice: Person = { name: "Alice", age: 30 };
   18|const greeting: string = greet(alice);
 > 19|const sum: number = add(2, 3);
                          ^
   20|console.log(greeting);
   21|console.log("Sum:", sum);
   22|

Locals:
@v1  greet     Function greet(person)
@v2  add       Function add(a,b)
@v3  alice     Object { name: "Alice", age: 30 }
@v4  greeting  "Hello, Alice! Age: 30"

Stack:
@f0  (anonymous)  ./src/app.ts:19:21
@f1  run          node:internal/modules/esm/module_job:413:25

Breakpoints: 1 active
Usage
# Node.js
dbg launch --brk node app.js

# TypeScript (via tsx)
dbg launch --brk tsx src/app.ts

# Bun
dbg launch --brk bun app.ts

# C/C++ (via LLDB)
dbg launch --brk --runtime lldb ./my_program

# Attach to a running process (any runtime with --inspect)
dbg attach 9229

# Attach to a Bun process (or a Bun-compiled binary) started with BUN_INSPECT.
# `?break=1` holds the process until dbg attaches, then pauses on its first statement.
BUN_INSPECT='ws://localhost:6499/app?break=1' ./my-bun-binary
dbg attach ws://localhost:6499/app

# Debug loop
dbg break src/handler.ts:42
dbg continue
dbg vars
dbg props @v3
dbg eval "x + 1"
dbg step over
dbg set @v1 100
dbg hotpatch src/handler.ts   # live-edit from disk (JS/TS only)
dbg stop
Commands
| Category | Commands |
|---|
| Session | launch, attach, stop, status, sessions |
| Execution | continue, step [over|into|out], pause, run-to, restart-frame |
| Inspection | state, vars, stack, eval, props, source, scripts, search, console, exceptions |
| Breakpoints | break, break-rm, break-ls, break-toggle, breakable, logpoint, catch, break-fn |
| Mutation | set, set-return, hotpatch |
| Blackbox | blackbox, blackbox-ls, blackbox-rm |
dbg --help full reference
dbg — Debugger CLI for AI agents

Usage: dbg <command> [options]

Session:
  launch [--brk] <command...>      Start + attach debugger
    [--dsym <path>] [--source-map <from>:<to>]
  attach <pid|ws-url|port>         Attach to running process
  stop                             Kill process + daemon
  sessions [--cleanup]             List active sessions
  status                           Session info

Execution (returns state automatically):
  continue [--wait <seconds>]      Resume execution; --wait blocks until the next pause or exit
  step [over|into|out]             Step one statement
  run-to <file>:<line>             Continue to location
  pause                            Interrupt running process
  restart-frame [@fN]              Re-execute frame from beginning

Inspection:
  state [-v|-s|-b|-c]              Debug state snapshot
    [--depth N] [--lines N] [--frame @fN] [--all-scopes] [--compact] [--generated]
  vars [name...]                   Show local variables
    [--frame @fN] [--all-scopes]
  stack [--async-depth N]          Show call stack
    [--generated] [--filter <keyword>]
  eval <expression>                Evaluate expression
    [--frame @fN] [--silent] [--timeout SECONDS] [--side-effect-free]
  props <@ref>                     Expand object properties
    [--own] [--depth N] [--private] [--internal]
  source [--lines N]               Show source code
    [--file <path>] [--all] [--generated]
  search <query>                   Search loaded scripts
    [--regex] [--case-sensitive] [--file <id>]
  scripts [--filter <pattern>]     List loaded scripts
  modules [--filter <pattern>]     List loaded modules/libraries (DAP only)
  console [--since N] [--level]    Console output
    [--clear]
  exceptions [--since N]           Captured exceptions

Breakpoints:
  break <file>:<line>              Set breakpoint
    [--condition <expr>] [--hit-count <n>] [--continue] [--pattern <regex>:<line>]
  break-rm <BP#|all>               Remove breakpoint
  break-ls                         List breakpoints
  break-toggle <BP#|all>           Enable/disable breakpoints
  breakable <file>:<line>[-<end>]  List valid breakpoint locations
  logpoint <file>:<line> <args>    Set logpoint (console.log's arguments, e.g. '"x =", x')
    [--condition <expr>]
  catch [all|uncaught|caught|none|exit]  Pause on exceptions, or as the program exits

Mutation:
  set <@ref|name> <value>          Change variable value
  set-return <value>               Change return value (at return point)
  hotpatch <file> [--dry-run]      Live-edit script source

Blackboxing:
  blackbox <pattern...>            Skip stepping into matching scripts
  blackbox-ls                      List current patterns
  blackbox-rm <pattern|all>        Remove patterns

Source Maps:
  sourcemap [file]                 Show source map info
  sourcemap <script> --pretty      Show the script formatted; positions and breakpoints translate
  sourcemap <script> --map <file>  Pair the script with a map file, re-read as it changes
  sourcemap --disable              Disable resolution globally

Setup:
  install <adapter>                Download managed adapter binary
  install --list                   Show installed adapters

Diagnostics:
  logs [-f|--follow]               Show CDP protocol log
    [--limit N] [--domain <name>] [--clear]

Global flags:
  --session NAME                   Target session (default: "default")
  --json                           JSON output
  --color                          ANSI colors
  --help-agent                     LLM reference card
  --help                           Show this help
  --version                        Show version
What dbg puts in the debugged process
Nothing, for most of a session: breakpoints, stepping and inspection go through the inspector protocol. Three features evaluate code in the process, and say so in their output:
catch exit installs a process.on("exit") listener that pauses as the program exits. Bun gets it on every connection, because Bun drops inspector messages still queued when it exits, and the pause flushes them: without it, the last lines a program logs before exiting never reach dbg console.break-fn on a native function (JSON.parse) wraps it in place, since the engine cannot pause inside a native. The wrapper is removed with the breakpoint or when dbg disconnects; break-ls notes it.- Logpoints on Bun route their values through a no-op function on
globalThis, so that they never print into the program's own output.
Architecture
CLI (stateless)  -->  Unix socket IPC  -->  Daemon (per session)
                                              |
                                     DebugSession / DapSession
                                       /                \
                              CDP path (JS)          DAP path (native)
                                 |                       |
                           RuntimeAdapter            DapClient
                            /         \            (stdin/stdout)
                      NodeAdapter    BunAdapter         |
                      (CDP/V8)    (WebKit/JSC)     lldb-dap / etc.
                            \         /
                          CdpClient (WebSocket)
                                 |
                          V8/JSC Inspector
The daemon manages two session types:
- DebugSession (CDP) — for JavaScript runtimes (Node.js, Bun). Uses
RuntimeAdapter to handle protocol differences between V8 and JSC.
- DapSession (DAP) — for native debuggers (LLDB, etc.). Communicates with a debug adapter over stdin/stdout using the Debug Adapter Protocol.


 @chromedevtools


