
Content
Plugin
ppt-report-skills
Turn data reports into 16:9 web-based slide decks — a Claude Code skill / standalone project template.

Plugin Signal50/100Fair
maintained55
capable14
documented100
adopted41
Install
$ npx -y skills add myunwang/ppt-report-skills --agent claude-code
Stats
81
Stars
0
Forks
Maintained
Maintenance
HTML
Language
MIT
License
3mo ago
Last commit
4mo ago
Created
Repo: myunwang/ppt-report-skills
What's inside
README
ppt-report-generator
English | 中文
Turn data reports into 16:9 web-based slide decks — a Claude Code skill / standalone project template. One file per slide · physical data separation · ECharts · 5 themes · one-click PDF export


Preview
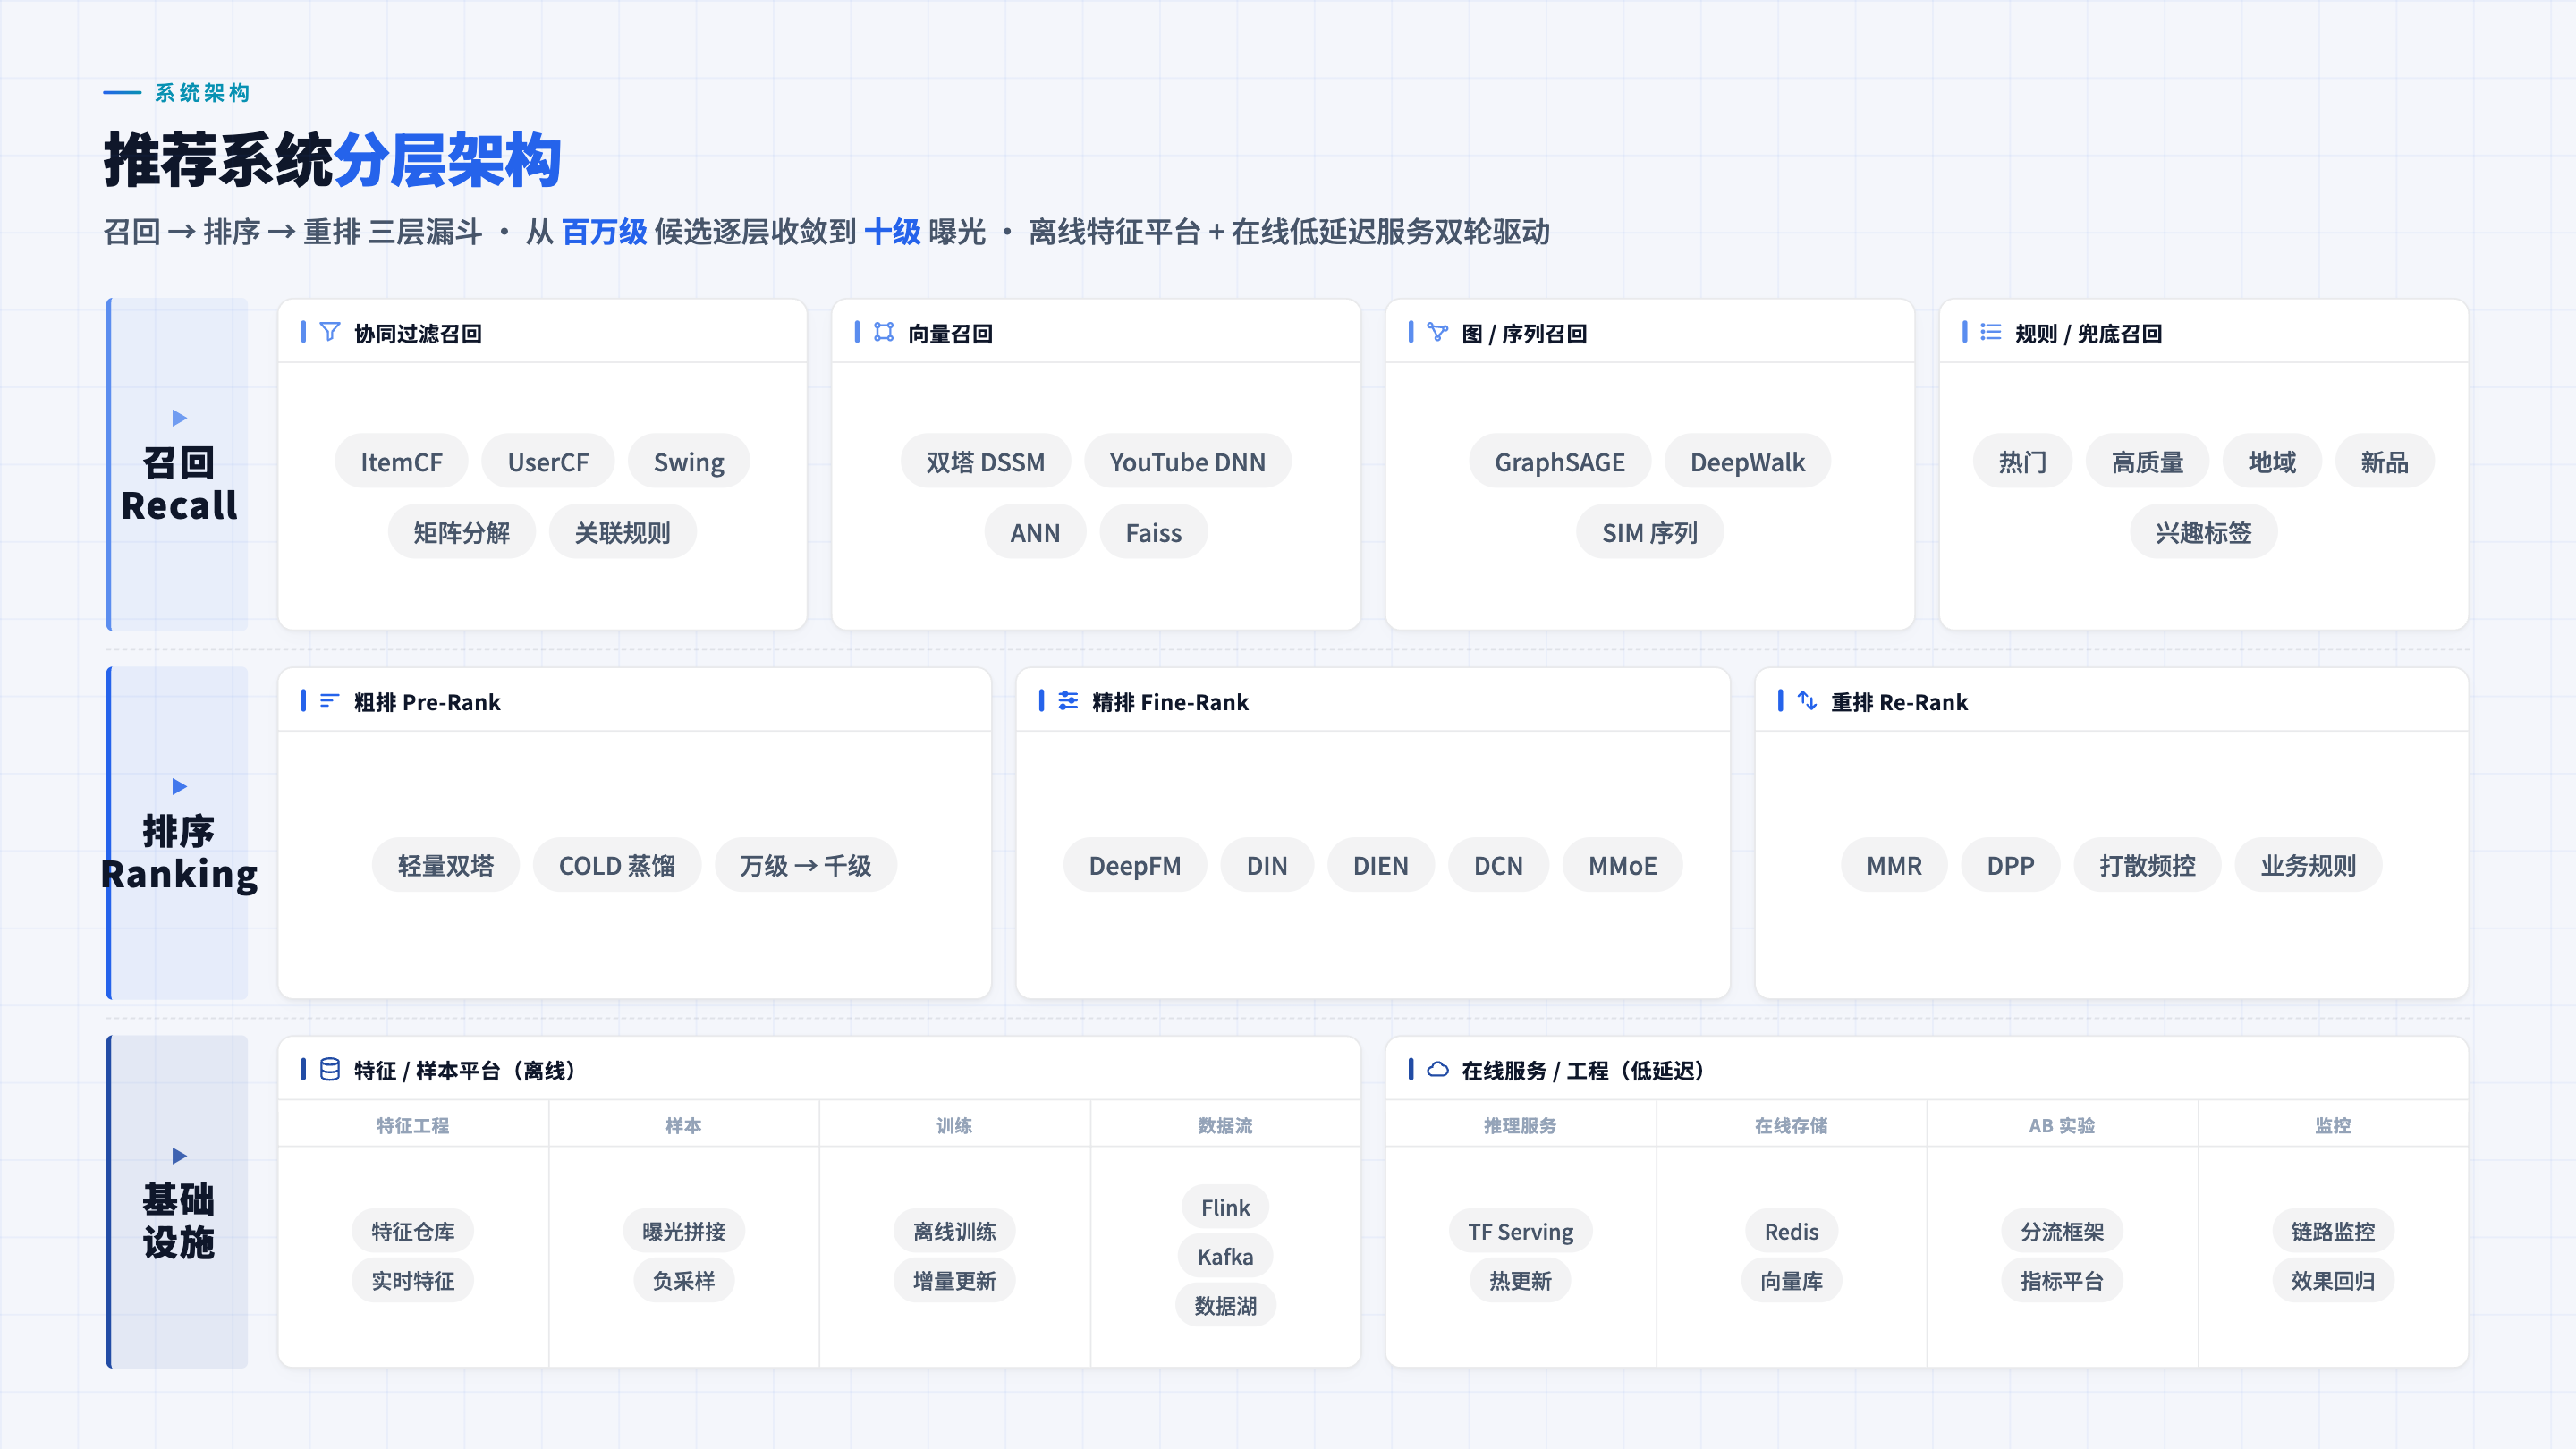
Recommender-system layered architecture (landscape-map template, no ECharts — pure CSS structure graph):
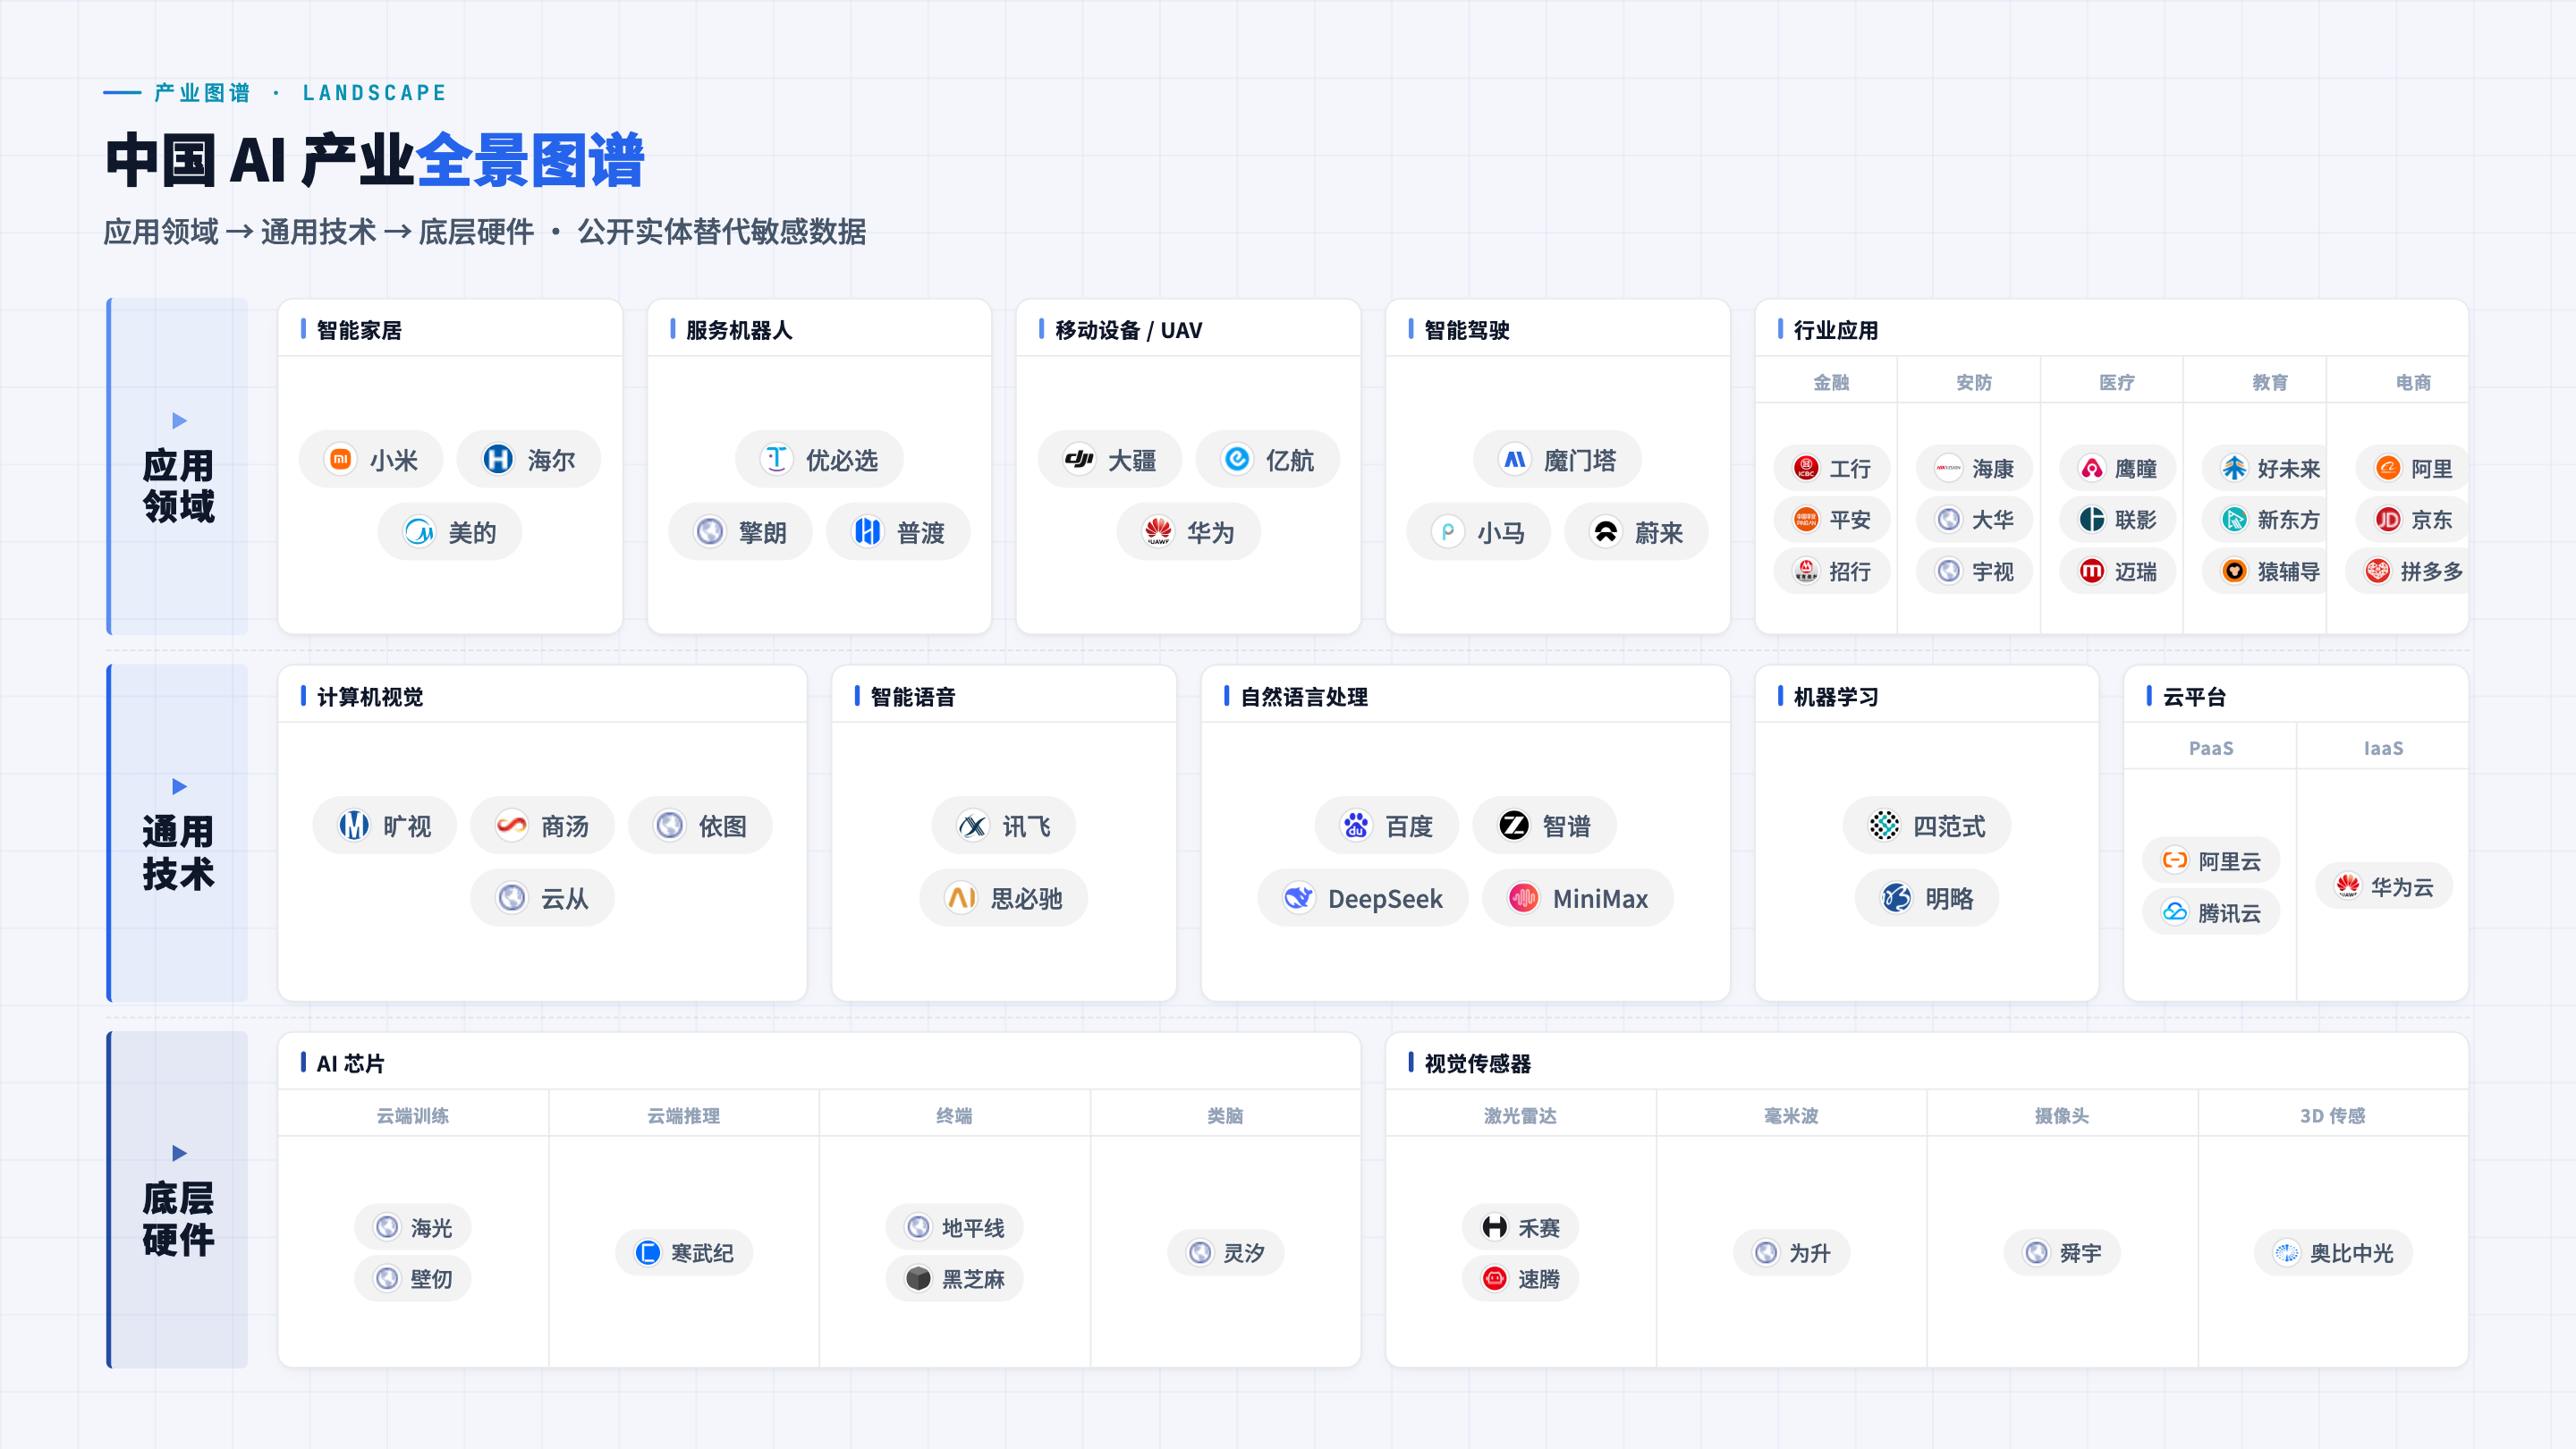
Industry landscape map (3-tier nested + logo wall; public entities replace sensitive data):
Human silhouette portrait (human-portrait template — data-driven, one-pass: a consulting-grade human silhouette with leader-line anchors auto-connecting to surrounding labels; born from "OpenAI IPO" deck, OpenClipart CC0):
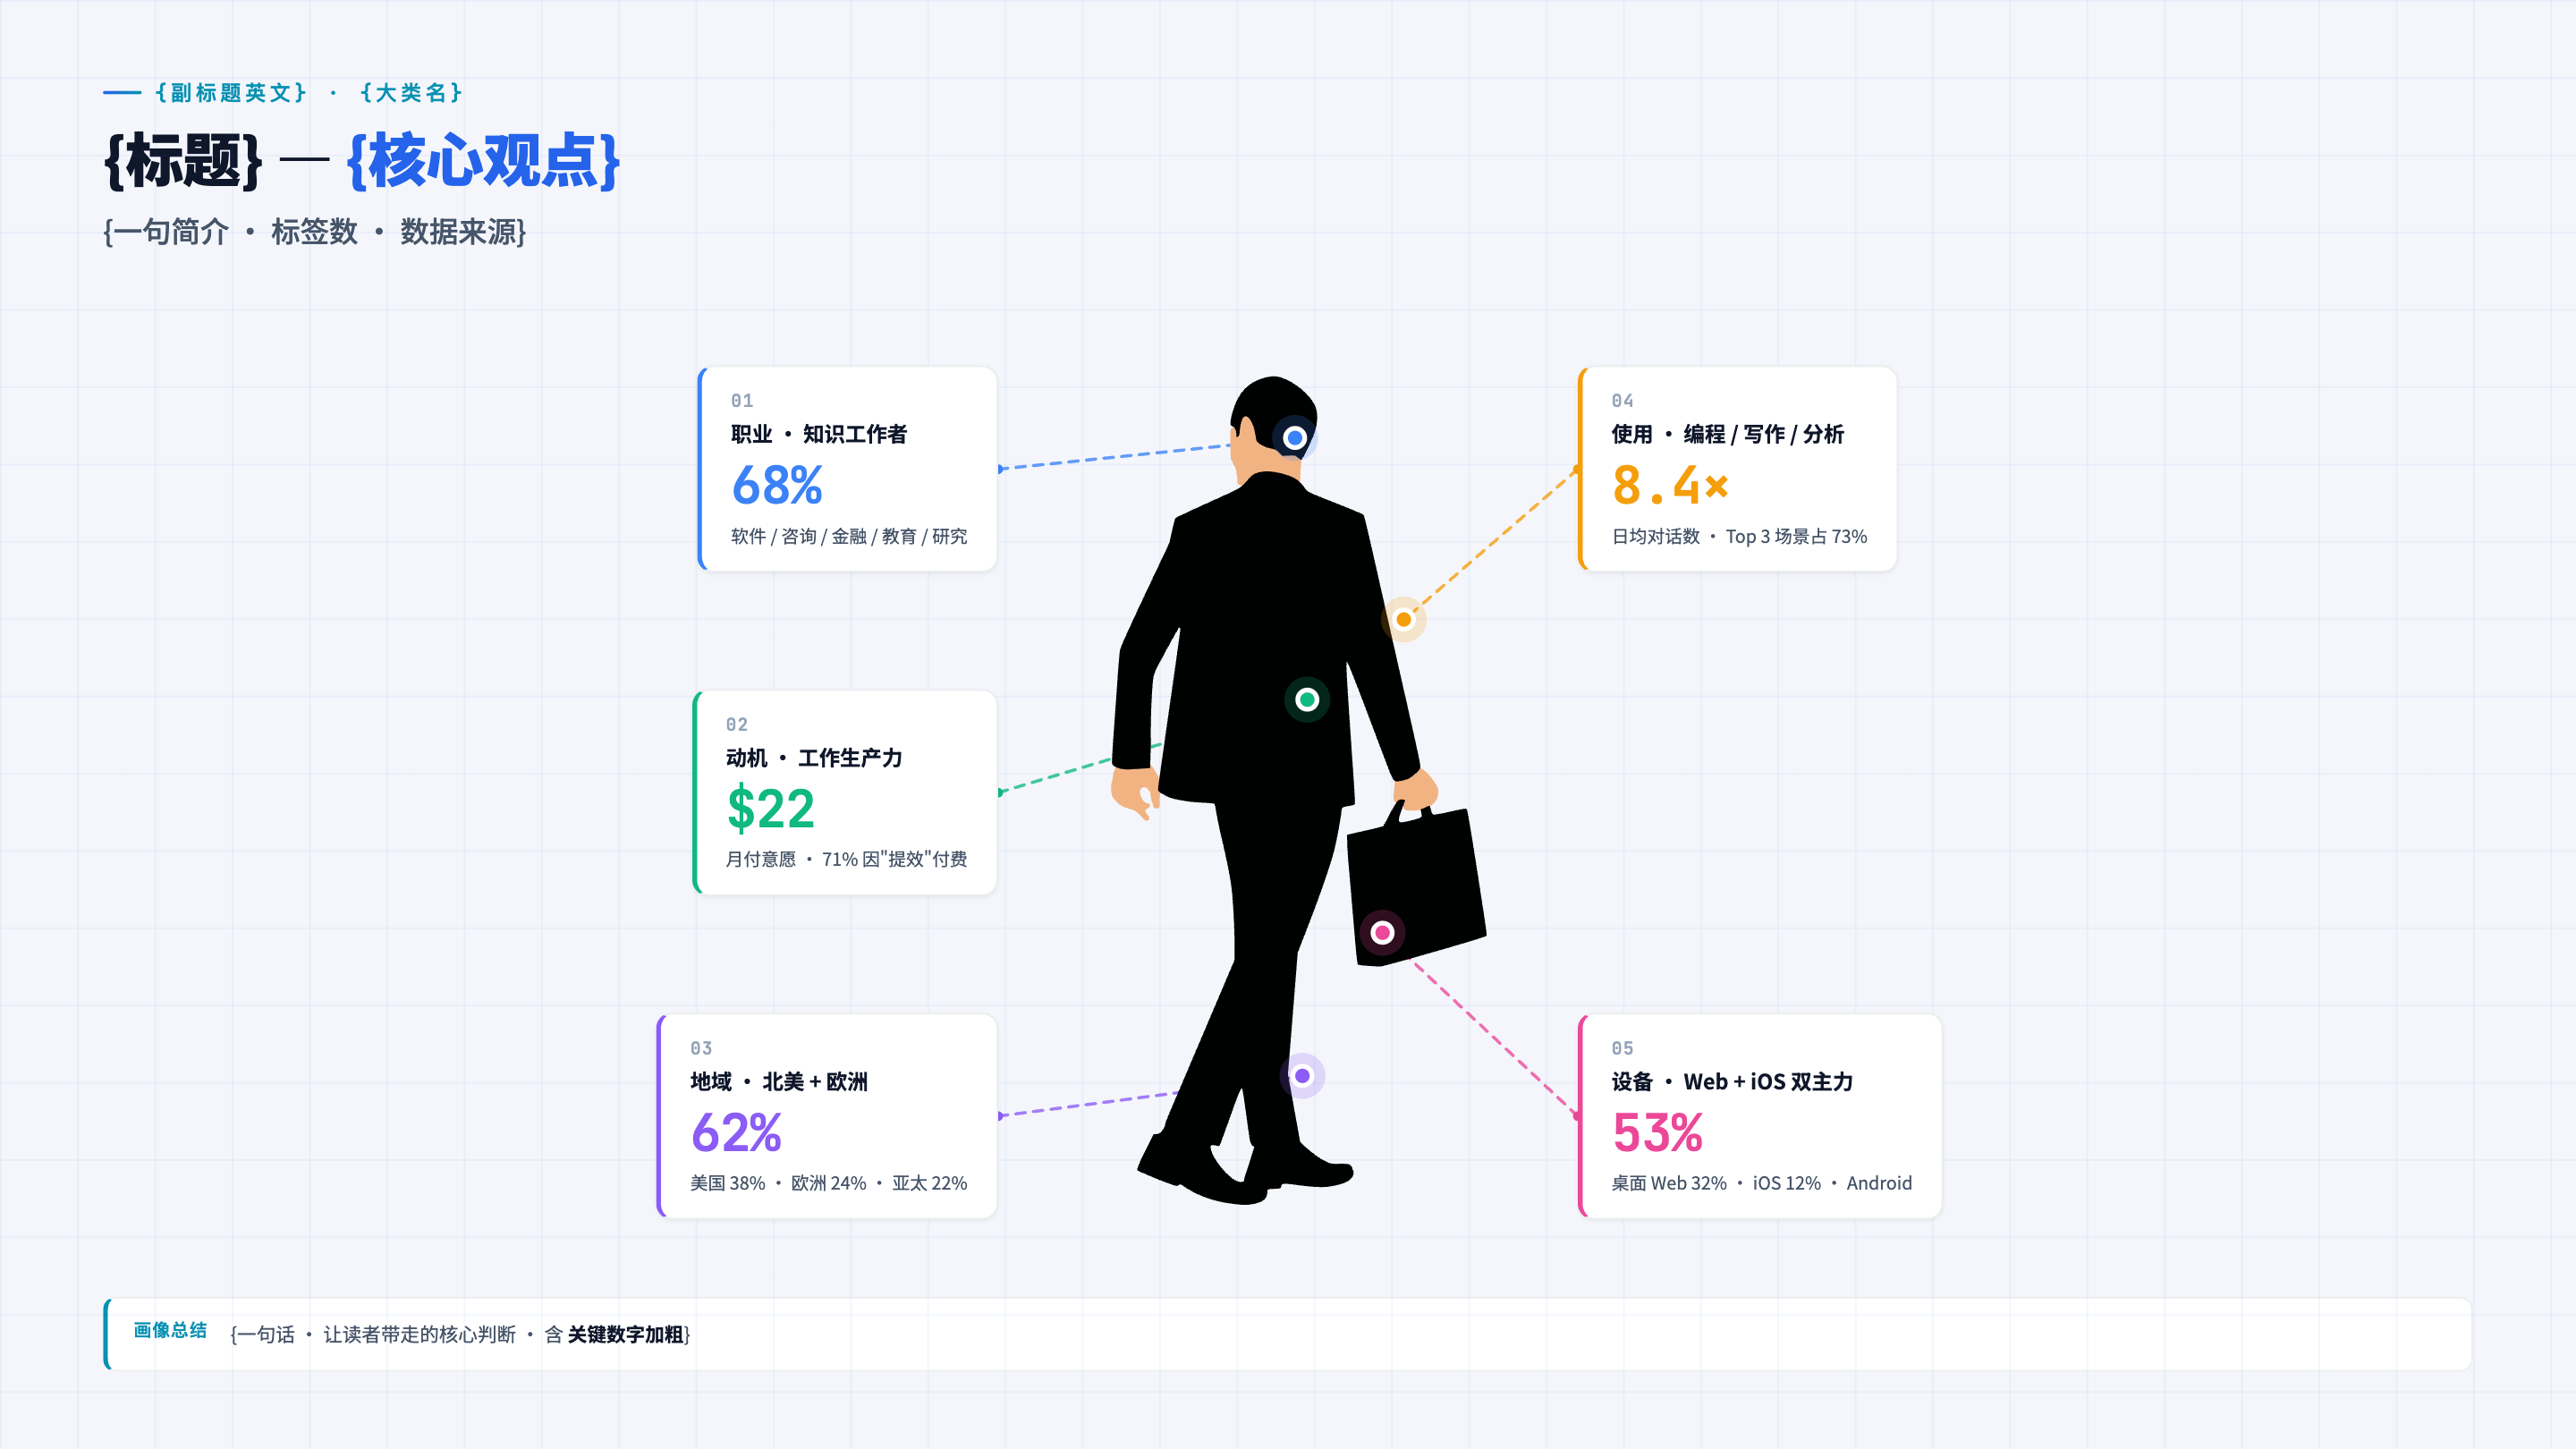
Central silhouette stays clean — colored dots (real SVG elements) on the silhouette mark body parts, and dashed leader lines auto-connect from each dot to its label card on the slide edges. You write only one block of
labelsdata (each bound to a bodypartlike head / heart / legs / shoulder / rightHand); the silhouette, anchor coordinates, dots, and leader lines are all computed automatically — no hand-drawn silhouette, no coordinate calibration, no manual leader-line placement. Works for user persona, anthropomorphic capability maps, job-risk heatmaps, and team pictograms.
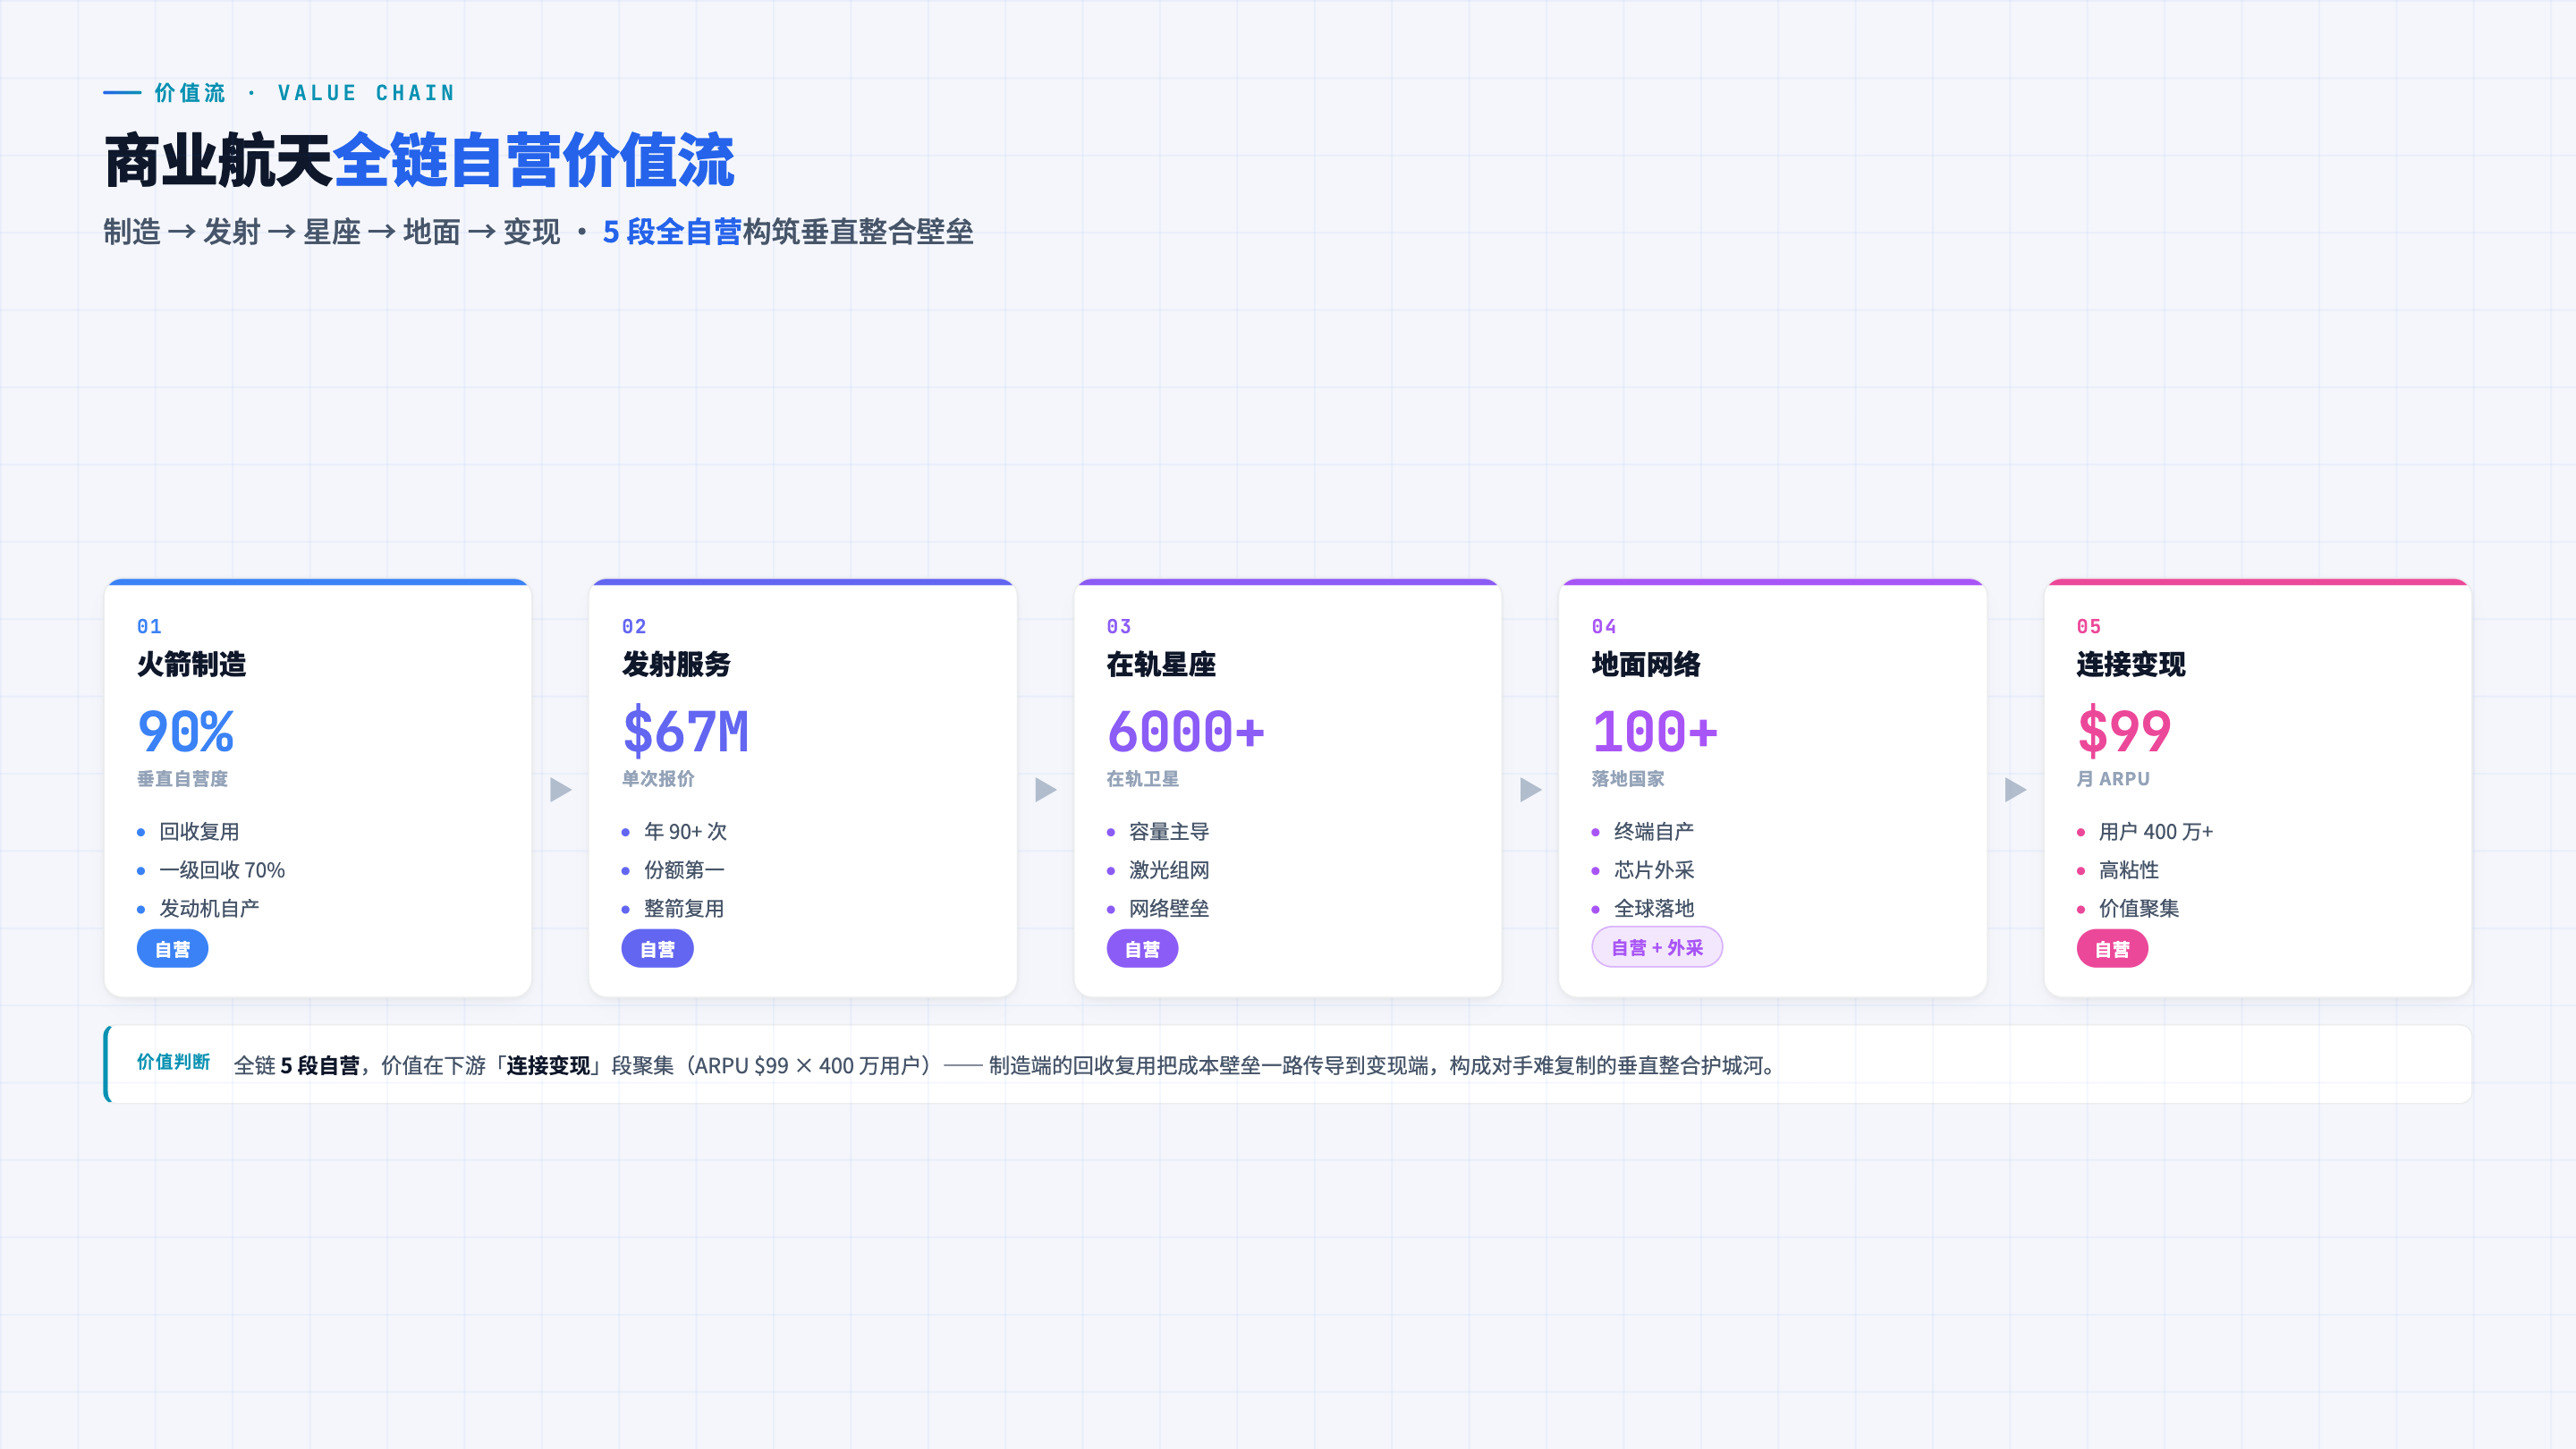
Value-flow chain (value-chain template — framework diagram for physical industries; horizontal value flow with self-operated / outsourced badges and a color gradient along the chain, pure CSS):
Vertical / portrait — for phone & social (portrait format — scenario-driven, low content density; one deck exports to any platform size: 小红书 3:4 / WeChat long-image / Stories 9:16 …):
What is this
A template that engineers the "data report → web slide deck" workflow. Two ways to use it:
- As a Claude Code Skill — drop this repo into
~/.claude/skills/ppt-report-generator/and let Claude build reports following this spec automatically - As a standalone project template — copy
assets/tosrc/and runpython3 build.pyto bundle a single HTML
What problem it solves
Slide tools (Keynote / Lark Docs / Google Slides) have a few chronic pain points for data reporting:
- ❌ Change one number → redraw the whole chart → half an hour gone
- ❌ Inconsistent font sizes across slides, misaligned cards, messy palette
- ❌ Want a different style? Redo every slide one by one
- ❌ Want Claude / GPT to fix one slide? You have to send the whole file — token explosion
ppt-report-generator solves this with an engineering approach:
- ✅ One slide = 3 small files (HTML + CSS + JS); changing a slide touches only 3 files of ≤ 200 lines each
- ✅ Data in Excel / CSV (JSON also supported); build auto-converts to JSON and injects it — next update only edits Excel, rendering code stays untouched
- ✅ 5 preset themes, switch with one click in the top-right corner — Business Navy / Tech Dark / Warm Business / Light Minimal / Minimal Mono
- ✅ ECharts charts + data-shape decision table, tells you which chart fits which data (refuses pie charts with 5+ slices)
- ✅ 8 font-size levels / 4 font weights / the "Golden 11" core principles — strict card-boundary alignment, no more "looks messy"
- ✅ Templates are single-file drop-ins — build.py auto-extracts their inline
<style>/<script>, so you just copy a template over and it plugs in (no need to split the style block into a separate css file) - ✅ One-click PDF export (playwright + img2pdf, 13.33×7.5 inch 16:9 standard)
What the repo provides
- 9 page templates (
assets/slides-templates/):kpi-overview— multi-section × multi-card overviewtwo-country— two-subject side-by-side comparison (KPI + metric table)three-phase— three-phase timeline + multiple chartsmulti-trend— multi-subject trend comparisonsupply-bars— categorical bars + trend lineslandscape-map— industry / competitor landscape (12-grid 3-tier nested + logo wall; fully static pure CSS, JS only injects logos)matrix-2x2— McKinsey / BCG-style 2×2 strategic matrix (4 quadrants + bubble positioning + 3 strategic insights; pure CSS, not ECharts scatter)human-portrait— consulting-grade human silhouette portraits, data-driven one-pass (male businessman with briefcase + female long-haired professional, OpenClipart CC0; central silhouette + body-part colored dots as real SVG elements + leader lines auto-connecting to surrounding label cards). You write only one block oflabelsdata — each bound to a bodypart(head / heart / legs / shoulder / rightHand) — and the silhouette, coordinates, dots, and leader lines are all computed automatically (no hand-drawn silhouette, no coordinate calibration, no manual leader-line placement). Use for user persona / anthropomorphic capability map / job-risk heatmap / team pictogram. Pre-baked intoscripts/silhouette.jsaswindow.SILHOUETTE+injectSilhouette()+renderHumanPortrait()— drop-in shared across all slidesvalue-chain— NEW ⭐ value-flow horizontal axis (physical-industry framework diagram) — the B skeleton fromlandscape-skeleton, for physical industries / asset-heavy businesses (commercial space, energy, manufacturing, consumer goods) to express "how value flows along the chain". 5–6 stage cards chained left-to-right with ▶ arrows, each carrying a core number + key activities + an own-vs-outsource badge, colors deepening along the chain. Fully static pure CSS, zero JS
- 5 preset themes: modern-light / dark-tech / warm-business / brand-blue / minimal-mono (one-click switch top-right, persisted via localStorage)
- 11 reference docs (
references/): architecture · design system · layout principles · chart selection · components · themes · landscape-skeleton · landscape-qa · matrix-2x2 · svg-aesthetics · human-portrait - Build scripts:
build.py(bundle HTML) +export_pdf.py(export PDF) +quickstart.sh(one-click init for a new project)
5-minute quickstart (standalone project mode)
# 1. Clone the repo
git clone https://github.com/<your-username>/ppt-report-generator.git
cd ppt-report-generator

# 2. One-click init a new project
./quickstart.sh ../my-report

# 3. Enter the project and start editing
cd ../my-report
# Edit src/slides/slide-1.html / src/data/slide-1.json ...
python3 build.py
open *.html       # Open in browser, ← / → to navigate

# 4. (Optional) Export PDF
pip install playwright img2pdf
playwright install chromium
python3 export_pdf.py
Using it as a Claude Code Skill
# macOS / Linux
mkdir -p ~/.claude/skills
git clone https://github.com/<your-username>/ppt-report-generator.git ~/.claude/skills/ppt-report-generator
Then in Claude Code just say "make a monthly report" / "turn this data into a slide deck", and Claude will follow this skill's workflow automatically: pick a page template → organize data in src/data/slide-N.xlsx → lay out using the 8 font-size levels + the "Golden 11" principles → call the matching ECharts template function → output via build.py.
Language: the skill spec and reference docs ship in two languages. The repo root (
SKILL.md,references/) is Chinese; a fully English version lives ini18n/en/(i18n/en/SKILL.md+i18n/en/references/, with an English trigger description). For English use, clone with that path as the skill root, e.g. point Claude Code ati18n/en/SKILL.md.
See SKILL.md for details.
Data format: Excel / CSV / JSON all work
Business data already lives in Excel — don't retype it into JSON:
src/data/
├── slide-1.xlsx    ← recommended — multiple sheets auto-convert to multiple JSON keys
├── slide-2.csv     ← single-table data
└── slide-3.json    ← complex nested structure / machine-generated
xlsx conversion rule: each sheet → one top-level JSON key, each row → one object ({header: value}). Sheets/columns starting with _ are skipped.
Example: slide-3.xlsx contains sheet kpis (columns label/value/unit) and trend (columns week/na/eu); after build it's injected as:
window.__DATA_3__ = {
  kpis:  [{label: 'DAU', value: 12.4, unit: '万'}, {label: 'ARR', value: 48, unit: 'M USD'}],
  trend: [{week: 'W1', na: 12.1, eu: 8.4}, {week: 'W2', na: 12.4, eu: 8.6}]
}
xlsx dependency: pip install openpyxl (csv / json use the standard library, no dependency). See references/architecture.md.
Repo structure
File tree
FAQ
ppt-report-skills is a Claude Code plugin with 1 hand-picked skill for content work, indexed on Flowy. Install it with the command on its page. It includes ppt-report-skills. Its skills do not fire on their own yet. Request auto-invocation to have Flowy route them as you prompt. Free and open source.
- What is ppt-report-skills?
- Turn data reports into 16:9 web-based slide decks — a Claude Code skill / standalone project template.
- How do I install ppt-report-skills?
- Run these in Claude Code: npx -y skills add myunwang/ppt-report-skills --agent claude-code. Then prompt normally.
- Does ppt-report-skills auto-invoke its skills?
- Not yet. It is indexed on Flowy as a plain plugin. Request auto-invocation on its page and Flowy will route its skills for you as you prompt.
- Is ppt-report-skills free?
- Yes. Flowy is free and open source, with nothing gated. You can read every skill in full before you install.
Is this plugin yours?
Claim it with GitHubSubmit a pluginPromote it