
Content
Plugin
nice-figures
A scientific & blog plotting library built for AI agents. It teaches an agent to generate matplotlib figures in a soft-pastel, research-blog visual register — the kind of plot you see in modern ML/alignment write-ups.

Plugin Signal47/100Fair
maintained57
capable14
documented100
adopted22
Install on Claude Code
> /plugin marketplace add Mapika/nice-figures> /plugin install nice-figures@nice-figures
What's inside
Badges

README
nice-figures
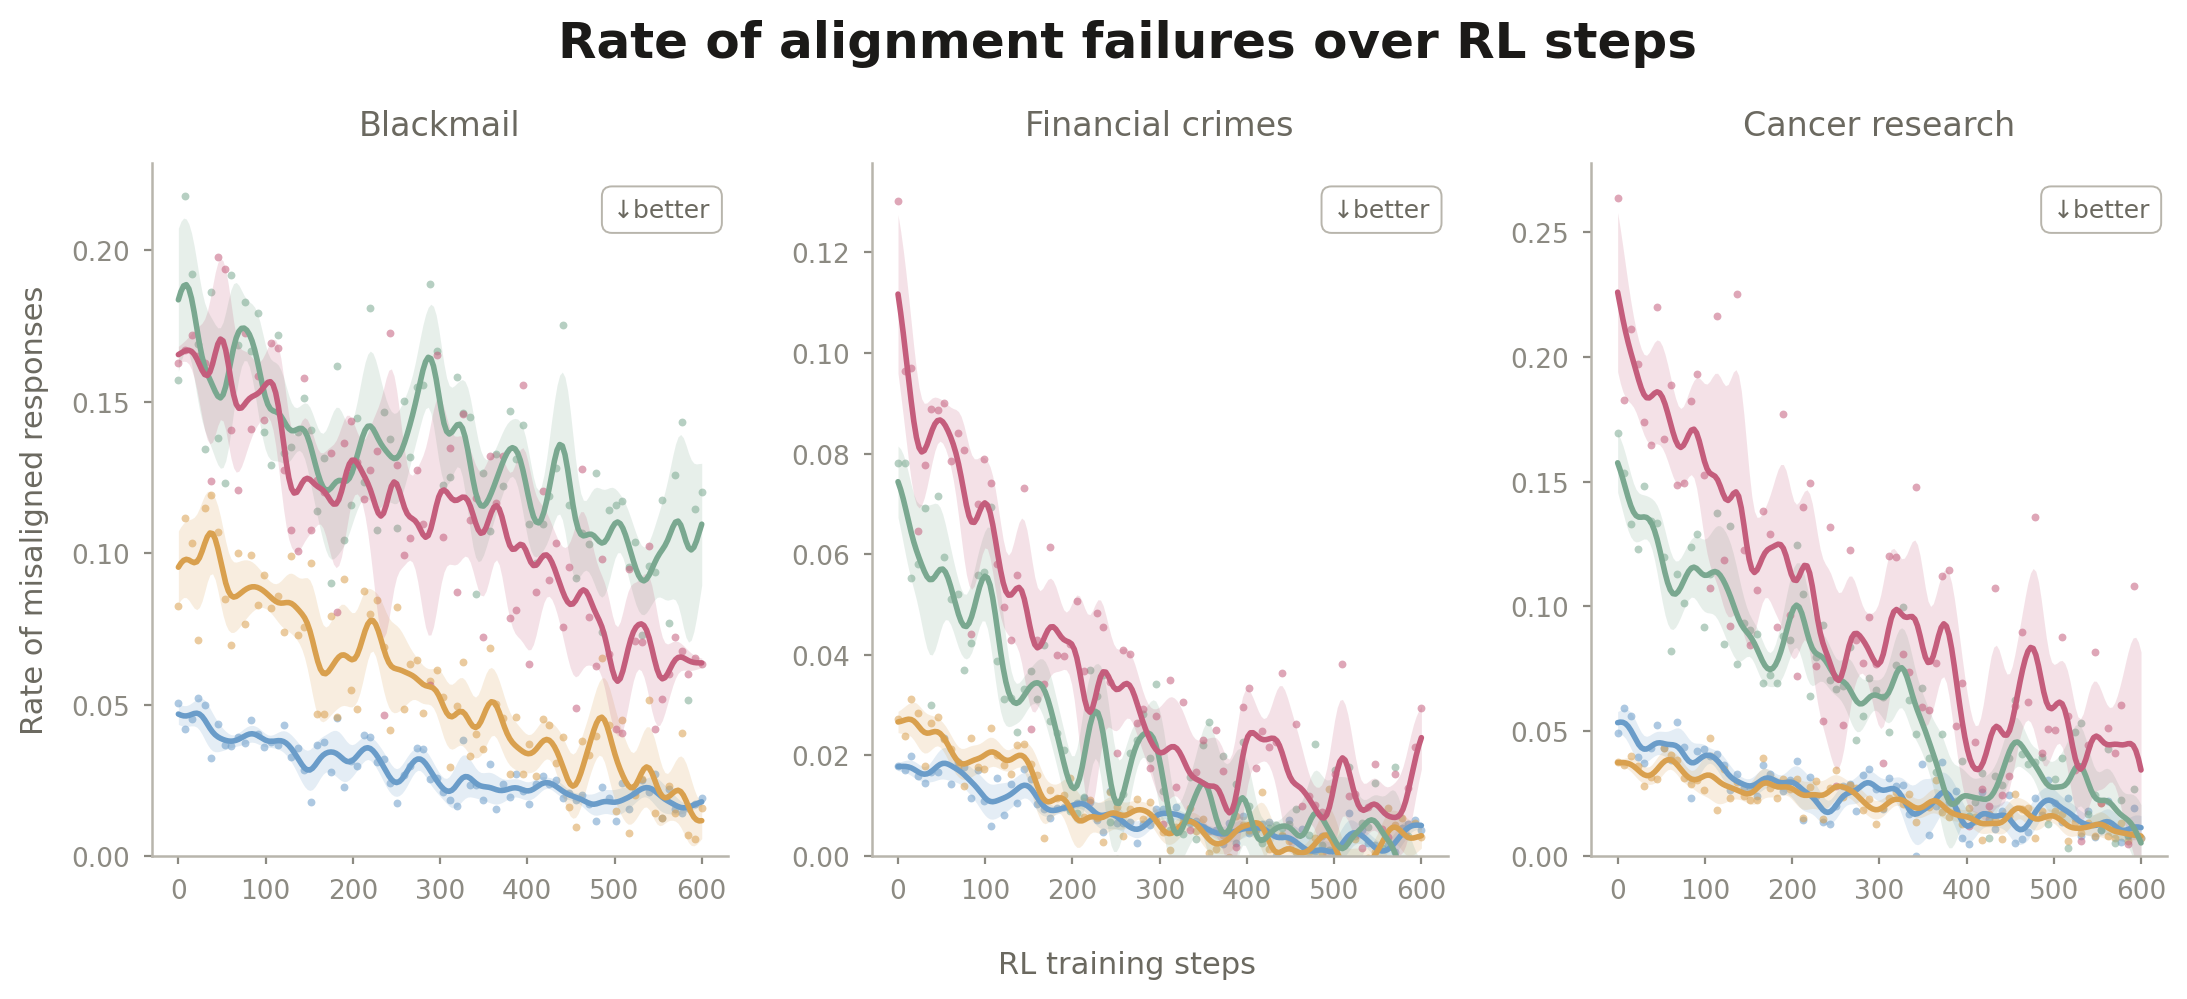
A scientific & blog plotting library built for AI agents. It teaches an agent to generate matplotlib figures in a soft-pastel, research-blog visual register — the kind of plot you see in modern ML/alignment write-ups. Bold sans-serif display titles, scatter overlaid with smoothed trends and shaded confidence bands, signature rounded bars, minimal axes, and ↓better badges. White background by default, so the output is conference- and paper-ready (PDFs embed Type 42 fonts, so they pass IEEE/ACM/NeurIPS font checkers).
Why agent-first matters in practice:
- Recipes, not docs. 16 copy-paste-runnable chart archetypes — every code block is executed in CI, so what the agent copies is never stale.
- A self-verification loop. The skill instructs the agent to render the PNG, look at it, and fix what it sees (legend collisions, unlabeled series, clipped bars) before delivering — the failure modes that "code ran fine" never catches.
- Opinionated defaults over choices. One style, tested helpers (
top_legend,plain_log_ticks,soft_colorbar,rounded_bars), and explicit common-mistakes lists, because agents do best when the right thing is the only documented thing.
For Claude Code it ships as a plugin with a skill that triggers automatically; any other agent (Codex, Cursor, …) can use it via AGENTS.md and pip install git+https://github.com/Mapika/nice-figures.
The style at a glance
Multi-panel training curves — scatter under a smoothed trend with a shaded band, minimal axes, and ↓better badges:
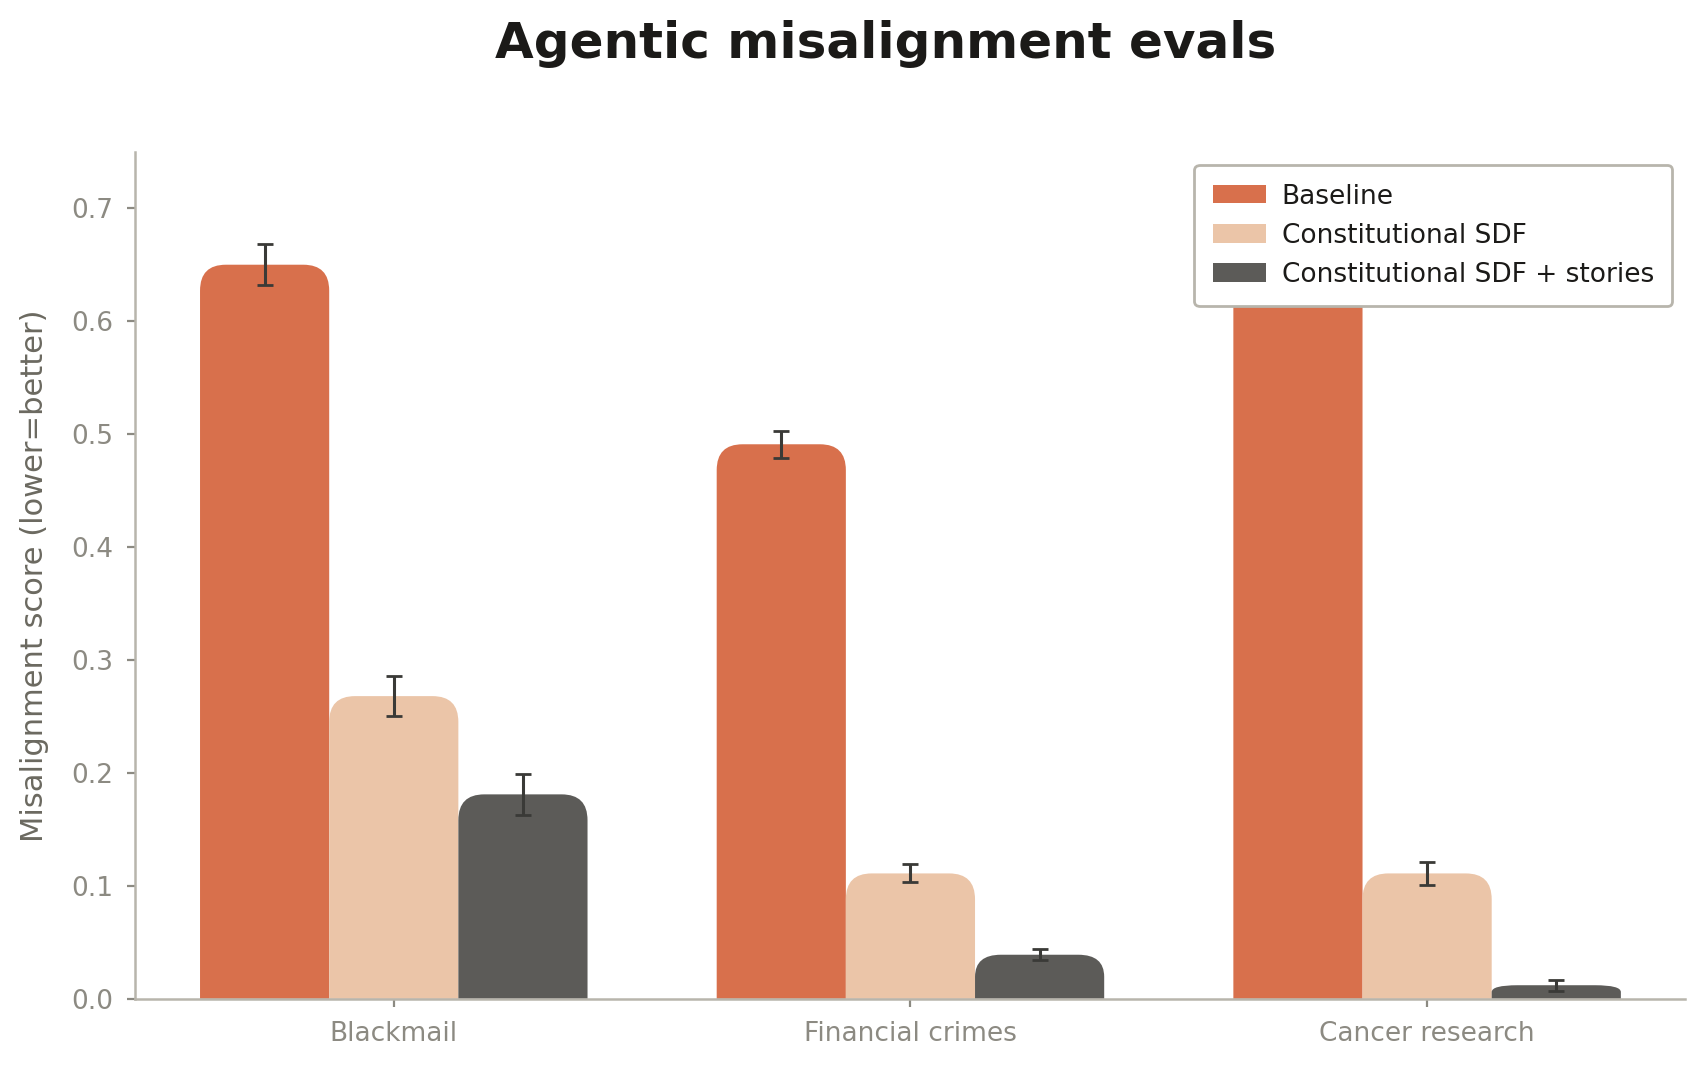
Grouped bars with the signature softly-rounded tops, in the warm coral/peach palette:
Kaplan/Chinchilla-style scaling laws — per-run loss curves colored by model size, tangent to the dashed compute-efficient frontier:
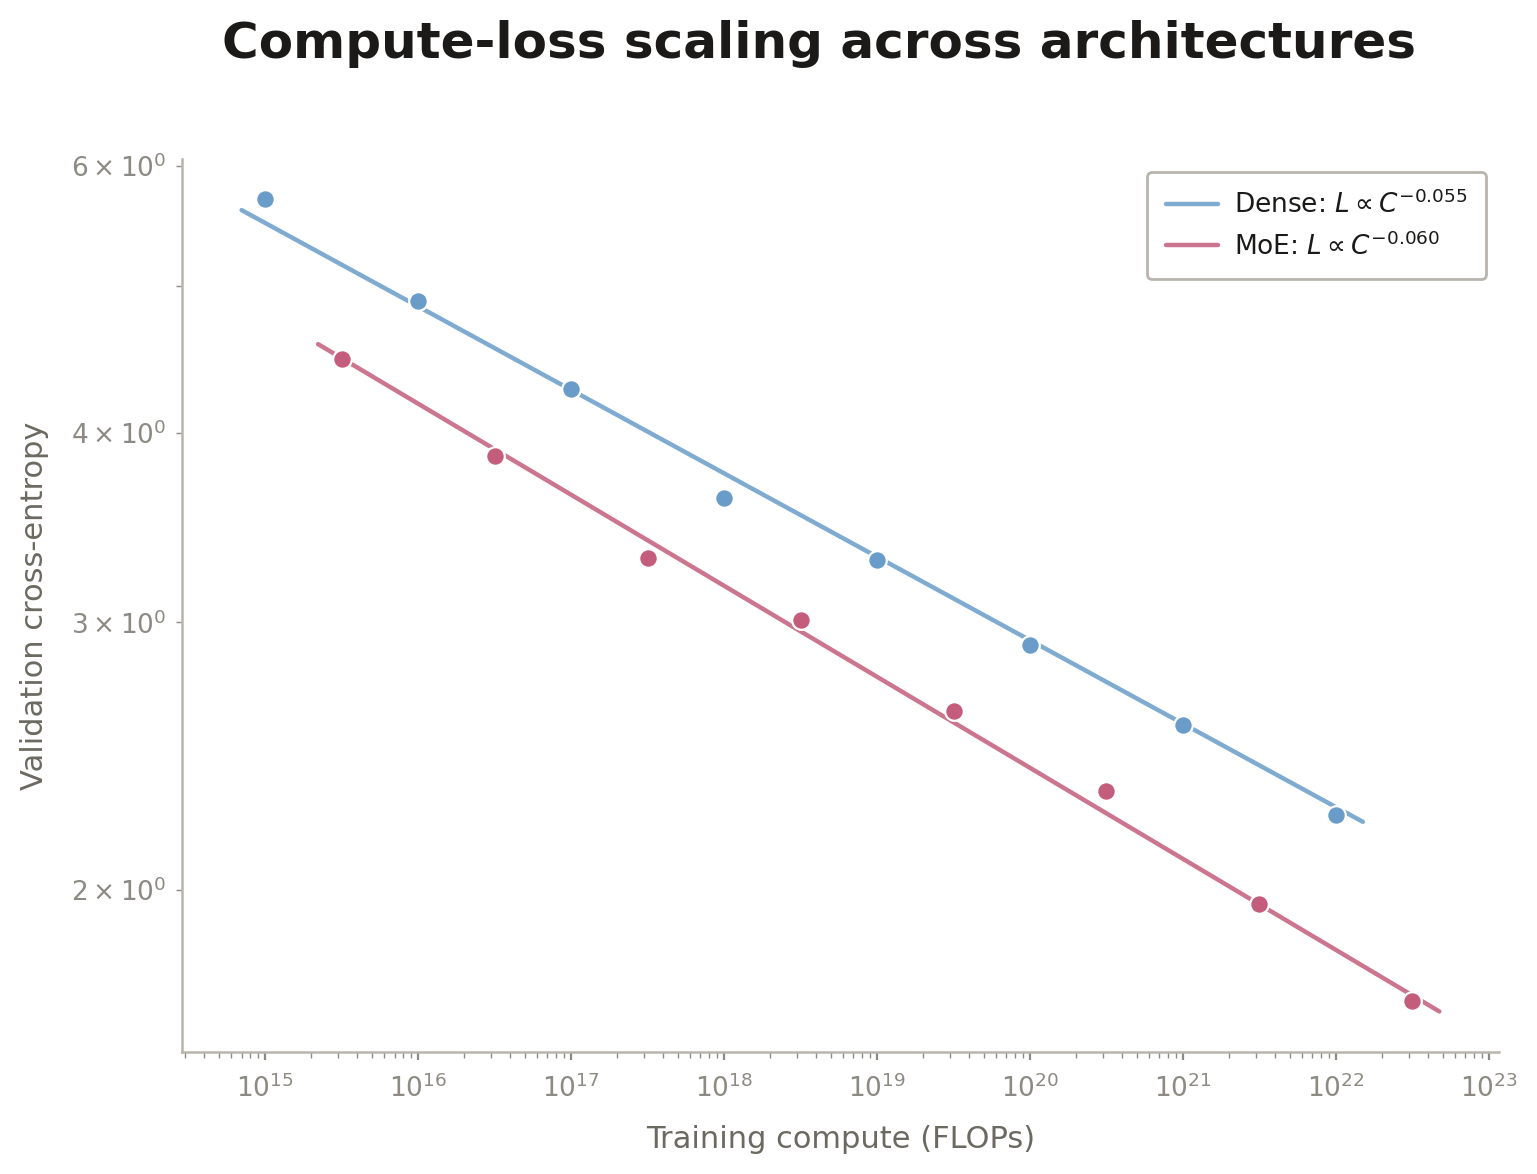
All three use synthetic placeholder data and are generated by assets/generate_showcase.py — run it to reproduce them.
Install
This repo is a Claude Code plugin marketplace. Add it, then install the plugin:
/plugin marketplace add Mapika/nice-figures
/plugin install nice-figures@nice-figures
To update later:
/plugin marketplace update nice-figures
Usage
Once installed, just describe the figure you want. Claude triggers the skill on requests like:
- "Make a training-curve plot of these RL scores with a smoothed trend and a shaded band, soft research-blog style."
- "Grouped bar chart comparing three models across four eval scenarios, with the rounded bar tops and error bars."
- "Scaling-law scatter on log-log axes with a power-law fit for our poster — clean white background."
- "Match the figure you made last week with the coral/peach bars."
You can also invoke it directly:
/nice-figures:nice-figures
Bring your own data (CSV or arrays) and Claude maps it onto the nearest recipe; describe a figure with no data and it generates a clearly-marked synthetic placeholder.
Other agents / plain Python
The style helper is a single dependency-light module, installable anywhere:
pip install git+https://github.com/Mapika/nice-figures
python -c "import soft_style"
AGENTS.md carries the agent-agnostic instructions (workflow, hard rules, the render-and-inspect loop) — point Codex/Cursor/your harness at the repo and it works without the Claude plugin machinery.
What's inside
AGENTS.md                        # agent-agnostic instructions (non-Claude harnesses)
plugins/nice-figures/skills/nice-figures/
├── SKILL.md                     # the skill: when to use it, conventions, gotchas
├── scripts/soft_style.py        # matplotlib style helpers (numpy + matplotlib only)
└── references/chart_recipes.md  # full code for all 16 chart archetypes
tests/                           # unit tests + every recipe executed end-to-end
The style
- Palettes —
LINE_PALETTE(blue/mustard/sage/pink) for trend lines,BAR_PALETTE(coral/peach/gray/olive) for bars,MULTILINE_PALETTEfor up to 5 categorical lines, plus sequential, diverging, and ordered-gradient colormaps. - Rounded bars — the signature look.
rounded_bars()/rounded_hbars()give softly rounded top corners computed in display space so they stay circular at any aspect ratio. - Smoothing + bands —
smooth_curve()androlling_band()for trend lines with tight shaded uncertainty bands. - Typography & axes — bold display title, gray subtitles and labels (never pure black), only bottom/left spines, no grid.
- Layout helpers —
top_legend()(legend above the axes, never on the data),plain_log_ticks(),soft_colorbar(). - Paper mode —
configure_style(scale=0.75)for single-column figures; Type 42 fonts embedded in every PDF. - Export —
save_figure()writes both PDF and PNG at 300 dpi.
The 16 archetypes
Trend-with-band, scatter + baseline, grouped bars, multi-line sweeps, heatmaps/confusion matrices, ROC/PR curves, distribution comparisons, box/violin, scaling-law fits, parity/calibration, 2D embeddings, ECDFs, forest plots, sorted horizontal bars, and Pareto fronts. Full copy-and-adapt code lives in references/chart_recipes.md.
Requirements
matplotlibandnumpy(the only hard dependencies of the style helper).- The Inter font is preferred and picked up automatically if installed; otherwise it falls back to Helvetica → Arial → DejaVu Sans.
License
MIT
File tree
FAQ
nice-figures is a Claude Code plugin with 1 hand-picked skill for content work, indexed on Flowy. Install it with the command on its page. It includes nice-figures. Its skills do not fire on their own yet. Request auto-invocation to have Flowy route them as you prompt. Free and open source.
- What is nice-figures?
- A scientific & blog plotting library built for AI agents. It teaches an agent to generate matplotlib figures in a soft-pastel, research-blog visual register — the kind of plot you see in modern ML/alignment write-ups.
- How do I install nice-figures?
- Run these in Claude Code: /plugin marketplace add Mapika/nice-figures then /plugin install nice-figures@nice-figures. Then prompt normally.
- Does nice-figures auto-invoke its skills?
- Not yet. It is indexed on Flowy as a plain plugin. Request auto-invocation on its page and Flowy will route its skills for you as you prompt.
- Is nice-figures free?
- Yes. Flowy is free and open source, with nothing gated. You can read every skill in full before you install.
Is this plugin yours?
Claim it with GitHubSubmit a pluginPromote it