
VerifiedPlugin
Content
Plugin
mckinsey-style-visualization-skill
Messy notes in. Board-ready slides out. One skill for your AI agent: turn notes, metrics, and prose into consulting-grade visuals — as real SVG slides, as an animated HTML deck, or as a spec any designer or tool can execute.
Plugin Signal64/100Solid
maintained94
capable14
documented100
adopted44
Install
$ npx -y skills add kgraph57/mckinsey-style-visualization-skill --agent claude-code
Stats
119
Stars
18
Forks
Active
Maintenance
Python
Language
MIT
License
13d ago
Last commit
7mo ago
Created
Repo: kgraph57/mckinsey-style-visualization-skill
What's inside
README
Strategy Consulting Visualization Skill
Messy notes in. Board-ready slides out.
One skill for your AI agent: turn notes, metrics, and prose into consulting-grade visuals — as real SVG slides, as an animated HTML deck, or as a spec any designer or tool can execute.
Rendering existing JSON specs into SVG/HTML uses the Python 3 standard library only, with no API key or network access required. Generating slides from notes in the browser requires your own Anthropic API key. The sample trial needs no key. Automated PDF export has optional browser dependencies.




English | 日本語
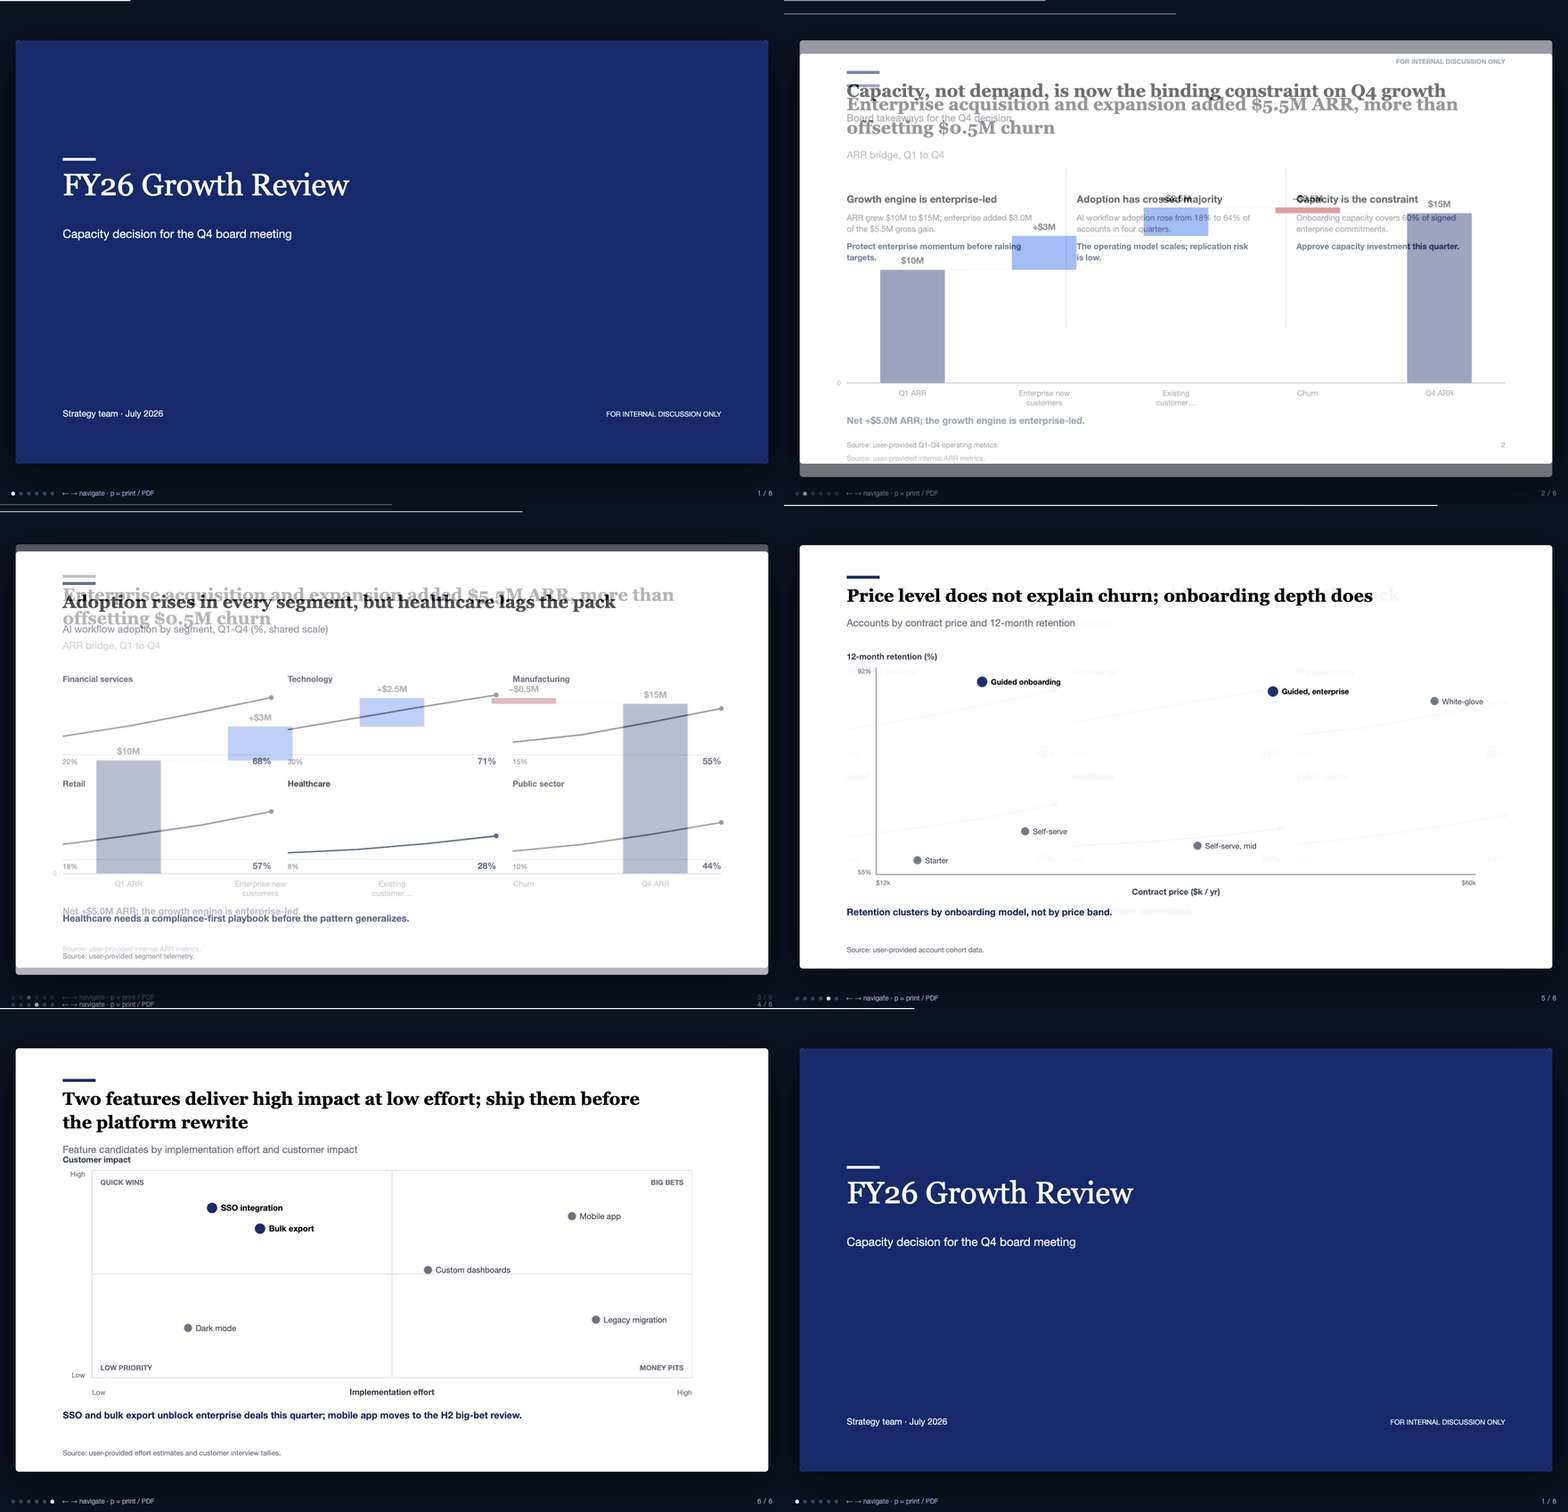
An actual deck built by this repo: specs (JSON) → SVG slides → animated HTML deck. Nothing hand-drawn.
Reproduce it: python3 scripts/scaffold_deck.py board-update -o demo && python3 scripts/build_html_deck.py --manifest demo/deck.json -o demo/deck.html
What’s new — September 9, 2026
Try a presentation on your phone before setting up an API key. Open the browser trial, choose Explore a sample deck, then Start presentation.
- Present directly in the browser. Swipe or use Previous / Next to move through slides; rotate your phone for a larger landscape view. Desktop keyboard navigation is also supported.
- Share or save HTML. Use the device share sheet where supported, with a download fallback. Present from the browser; reopening interactive HTML from iOS Files is not yet verified.
- Save a PDF. Choose PDF / Print, select landscape in the native print dialog, then use its share/save options. iOS may initially select A4 portrait.
- See the outcome before trying it. The homepage pairs a clearly labeled AI-generated hero concept with actual renderer output and a path from examples to the trial or installation.
- iOS fixes verified in Simulator. Japanese text and controls use an explicit Hiragino fallback; HTML sharing no longer creates an extra text file.
Tested with iPhone 17 / iOS 26.3 Simulator Safari: sample loading, presentation, swipe navigation, rotation, nine-page print preview, and PDF/HTML saving to Files. Existing 335 tests pass. Physical iPhone hardware, live API generation and AirPlay/projector output remain unverified. See the test record.
What’s new — September 8, 2026
- Refined business slides and diagrams. Updated the executive summary, growth waterfall, priority matrix, process flow and roadmap layouts, with clearer hierarchy, labels and decision cues. Regenerated the English and Japanese landing decks and site previews from the current renderer.
- Real deliverables on the site. The homepage now shows actual slide previews alongside a complete A4 brief, with links to the finished PDFs. Examples use illustrative business data.
- HTML first, PDF for sharing. Keep chart data in JSON and report prose in Markdown, refine the generated HTML, then export it directly to PDF. Decks and reports include a Save as PDF button;
scripts/export_pdf.pyalso supports command-line export. - Reference-based layouts. A design study of nine public documents from six consulting firms informs the analytical slide and compact report templates.
Explore the updated nine-slide board deck (PDF), one-page decision brief (PDF), and source HTML. See HTML to PDF for export commands. Automated PDF export requires Python Playwright and installed Chrome or Chromium; core SVG/HTML generation has no third-party Python dependencies.
Why This Gets Starred
- Install it and get a complete deck immediately.
scripts/scaffold_deck.py <archetype>copies a full, coherent 9-12 slide deck — cover through closing — into a working directory. Swap the illustrative data for yours and build. Six archetypes ship, one in Japanese. - It actually renders. 22 patterns produce real SVG slides — waterfall, executive summary, 2×2, scatter, heatmap, Gantt, small multiples, cover, section dividers, agendas, closings, and more. Every gallery image below is committed renderer output, verified fresh by CI on every push.
- Animated HTML decks from one command. Combine slides into a single self-contained HTML file: quiet staggered reveals, keyboard navigation, progress bar, zero external requests. Press
p→ your browser prints it → you have a PDF. - A browser-native report mode.
scripts/build_html_report.pyturns Markdown into a self-contained, print-to-A4 HTML document with numbered exhibits — the same visual system, for documents instead of decks. - Works with your slide tools. The SVGs drop straight into PowerPoint, Keynote, and Word (Insert → Picture). For Google Slides, export PNG from any browser first.
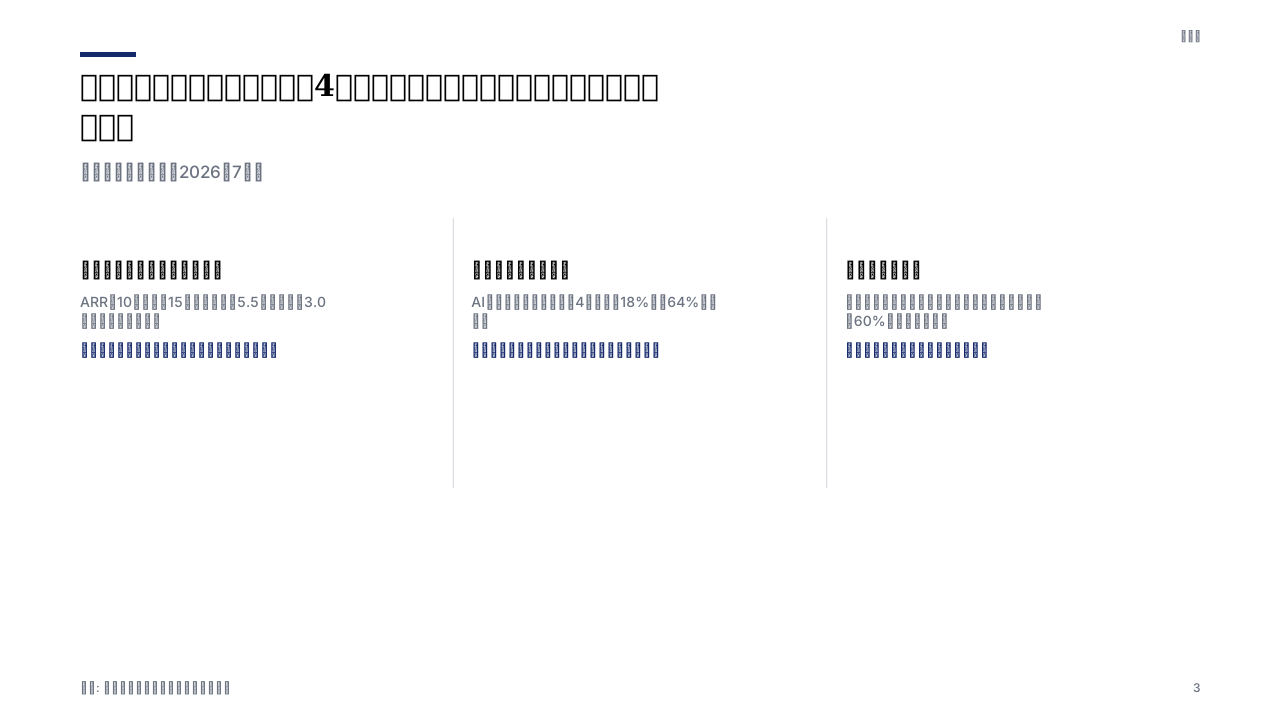
- Japanese business documents are first-class. CJK text wraps correctly (measured per fullwidth character, not by spaces), fonts fall back to Noto Sans JP / Hiragino, and there are dedicated profiles for 稟議書, 役員会資料, 週報, 学会抄録.
- Charts that survive an audit. Bar proportions match the data (Lie Factor ≈ 1.0), zero baselines are marked, cell text passes WCAG AA contrast across the whole color ramp, and the accent navy stays readable in greyscale print — all of it asserted in the test suite, not promised in prose.
- Roasted by five design legends, then fixed. We ran the whole system through a five-perspective design panel — Tufte's data-ink discipline, an ex-McKinsey chart master, Swiss grid typography, FT-style data journalism, and modern design engineering. They scored it 5.8/10 and listed every flaw. A previous release shipped every fix. Read the receipts.
60-Second Start
# 1. Install it as an agent skill (Claude Code, Cursor, Codex, and 70+ agents)
npx skills add kgraph57/mckinsey-style-visualization-skill
Or clone it directly (also gets you the runnable scripts below):
# 1. Get it (Claude Code clone install)
git clone https://github.com/kgraph57/mckinsey-style-visualization-skill.git ~/.claude/skills/strategy-consulting-visualization
cd ~/.claude/skills/strategy-consulting-visualization

# 2. Render one slide → SVG
python3 scripts/render_slide_spec.py examples/render-specs/arr-waterfall.json -o slide.svg

# 3. Build the full animated deck → one HTML file
python3 scripts/build_html_deck.py --manifest examples/demo-deck.json -o deck.html
open deck.html   # ← arrows to navigate, "p" to print → PDF
Or skip the terminal and just ask your agent:
Use the strategy consulting visualization skill to turn these notes into a board slide:
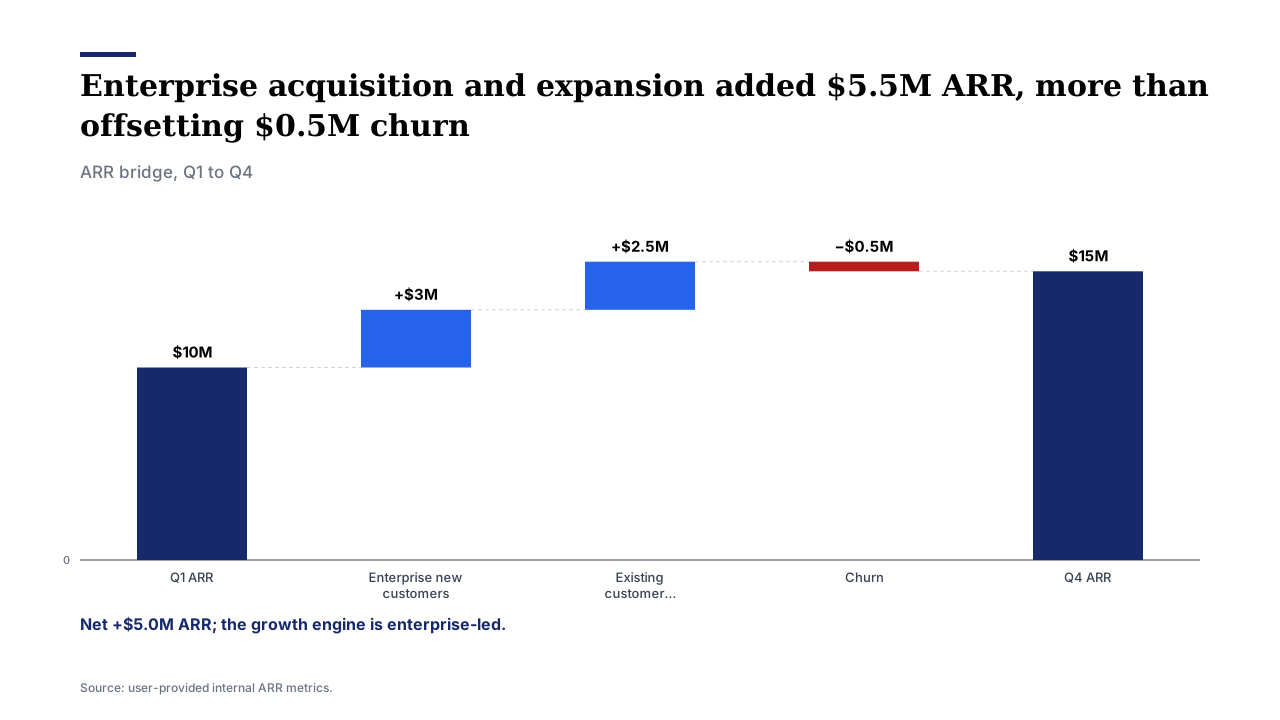
ARR grew from $10M to $15M. Enterprise added $3M, expansion $2.5M, churn -$0.5M.
The board must decide on implementation capacity investment.
The Pipeline
flowchart LR
    A["Messy notes,<br/>metrics, prose"] --> B["Slide spec<br/>(JSON)"]
    B --> C["SVG slides"]
    C --> D["Animated HTML deck"]
    C --> E["PowerPoint / Keynote / Word<br/>(insert SVG)"]
    D --> F["PDF<br/>(browser print)"]
Specs are plain JSON, so they diff, review, and version like code. The renderer and deck builder are single-file Python scripts with no installs.
Gallery
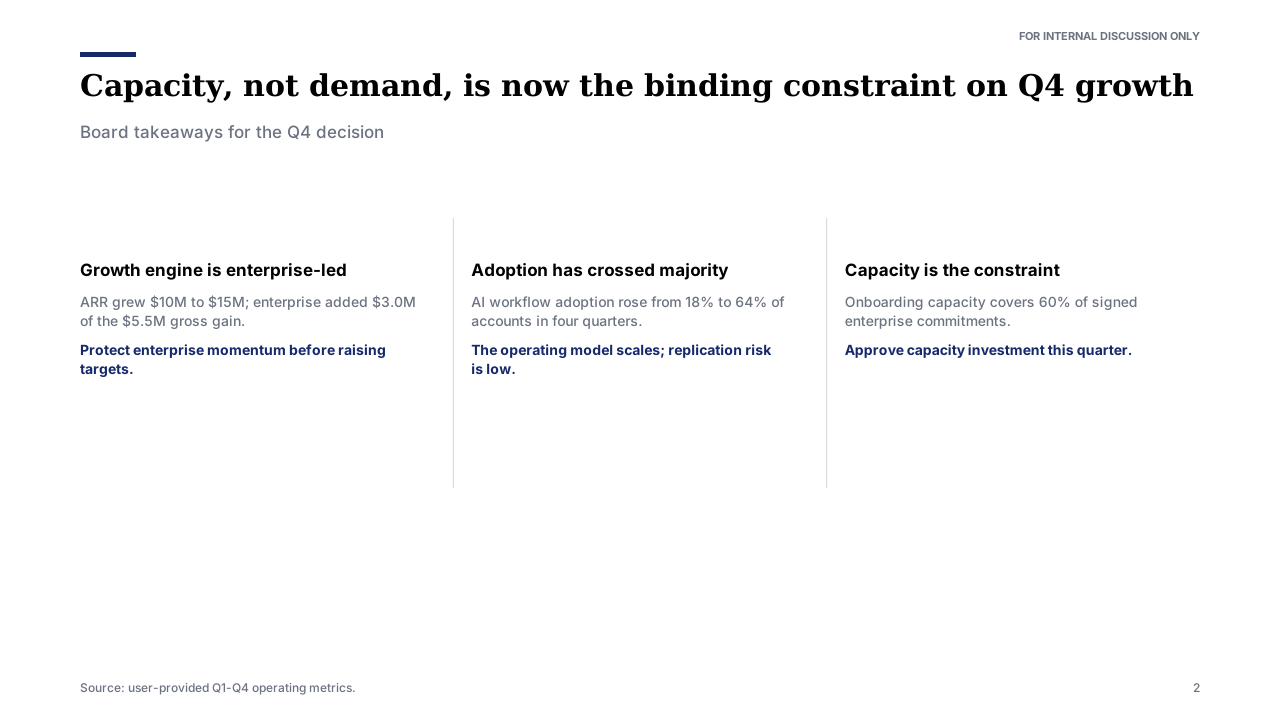
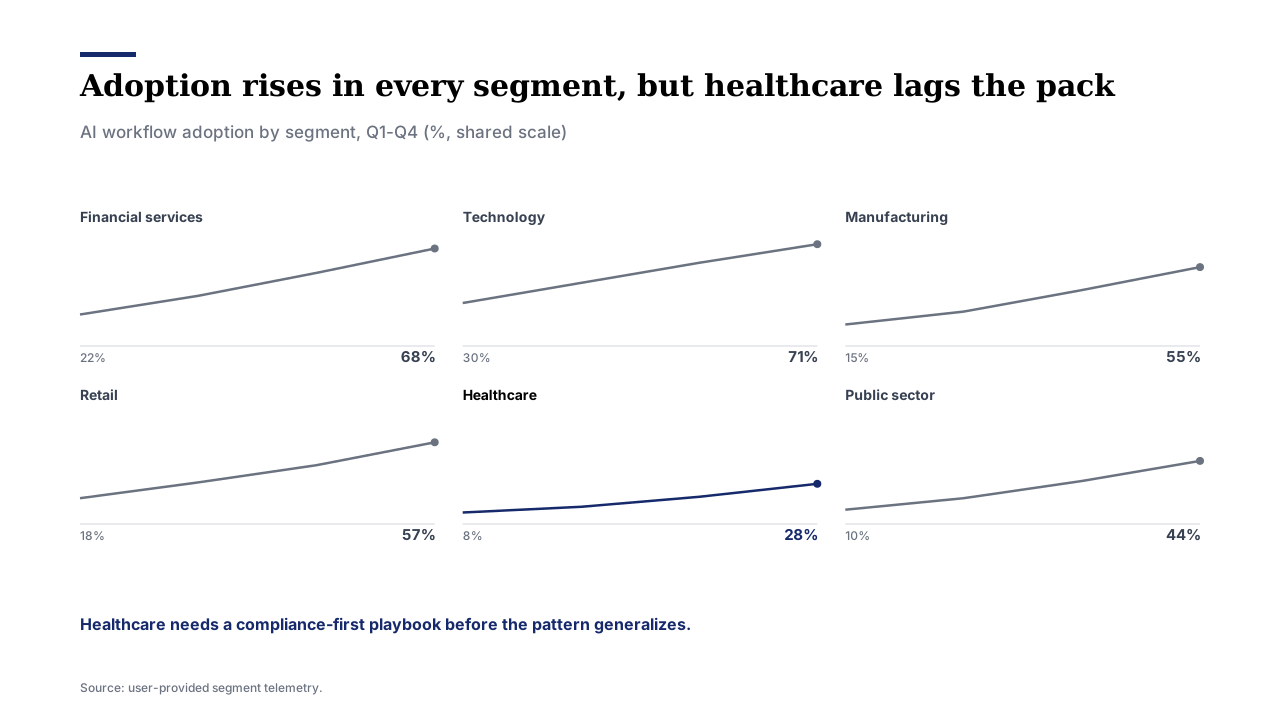
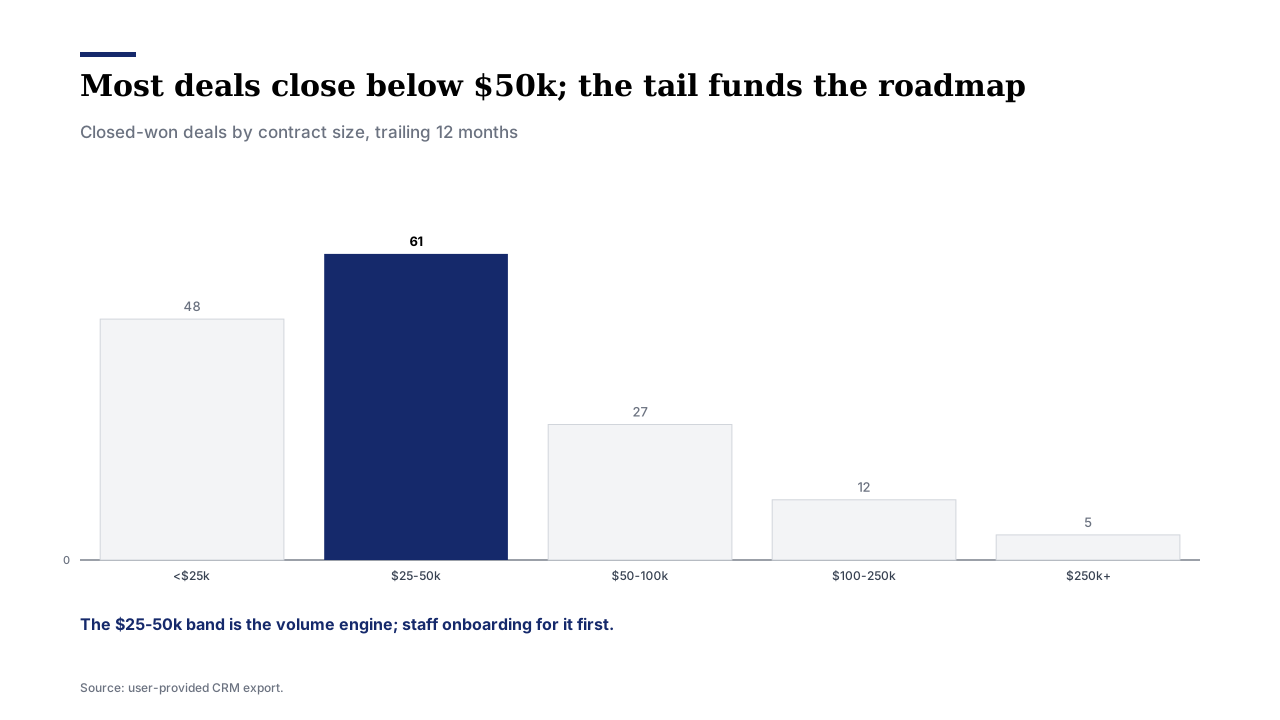
Every image is committed output of scripts/render_slide_spec.py — CI fails if any of them drifts from what the renderer actually produces. Specs live in examples/render-specs/.
| ARR Waterfall | Executive Summary Strip |
|---|---|
 |  |
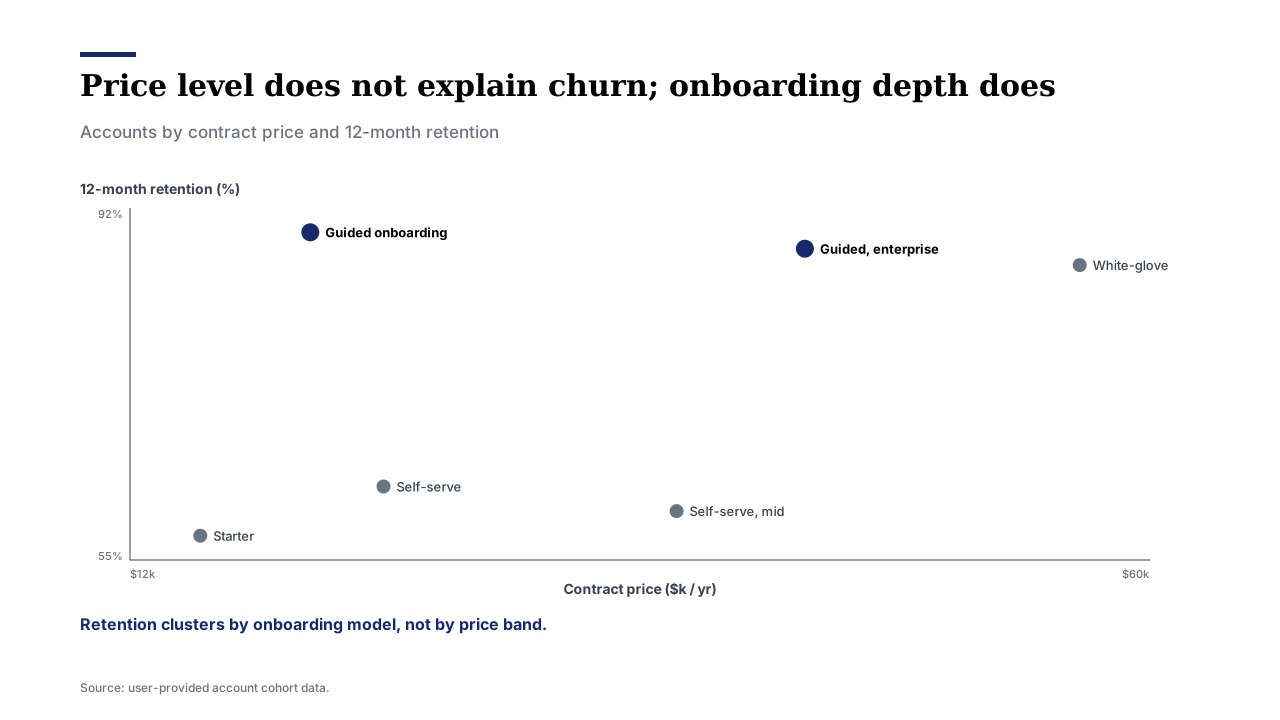
| Small Multiples | Scatter / Correlation |
|---|---|
 |  |
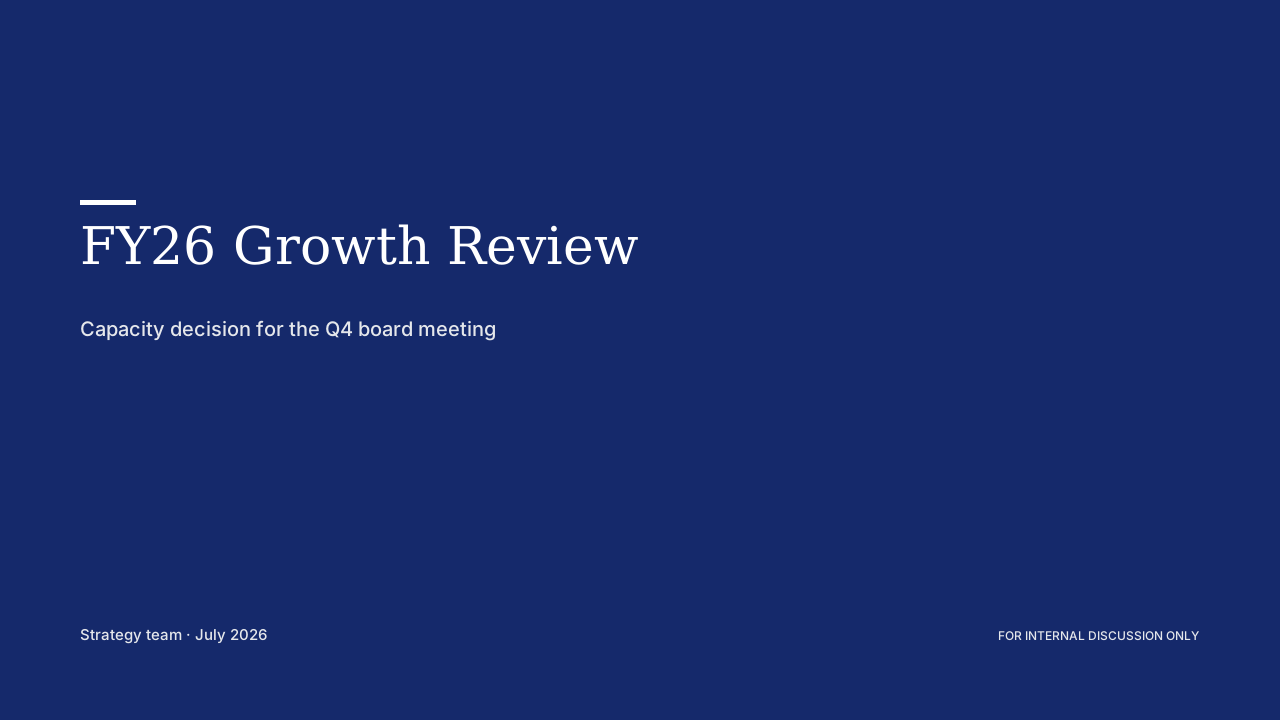
| Japanese Board Summary(役員会サマリー) | Cover Slide |
|---|---|
 |  |
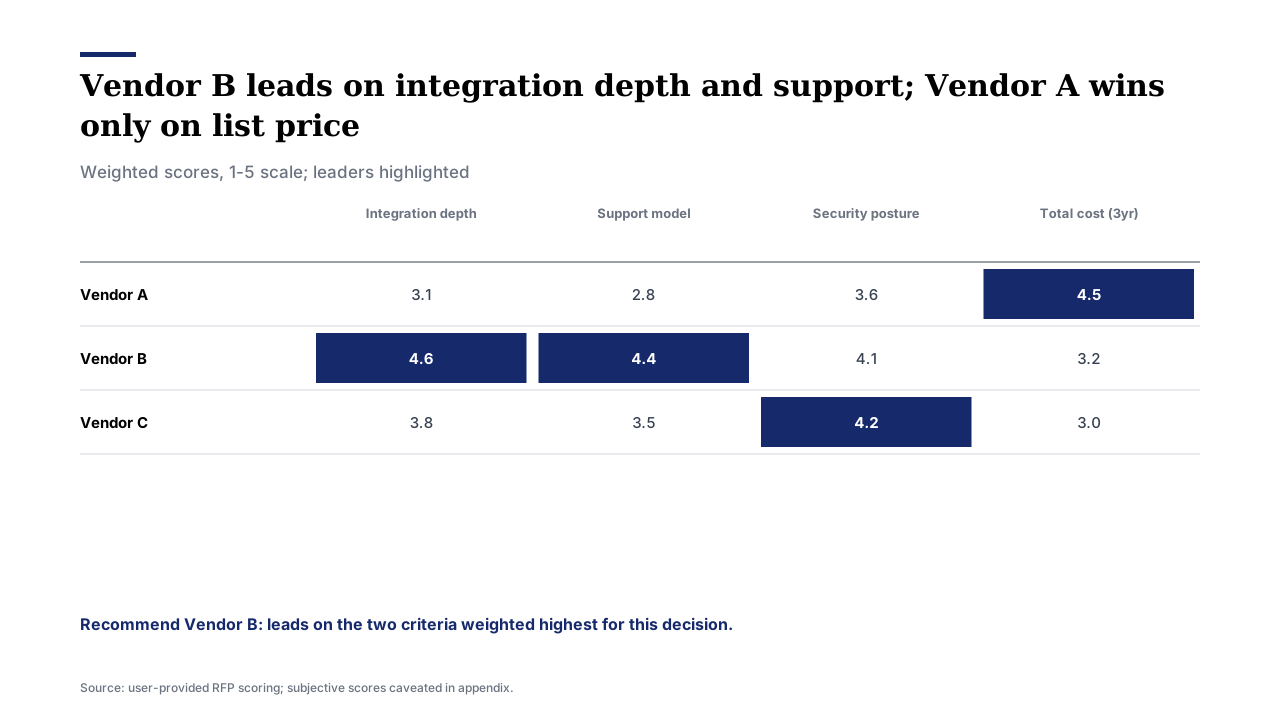
| Benchmark Table | Distribution |
|---|---|
 |  |
| Capacity Gap | Process Flow |
|---|---|
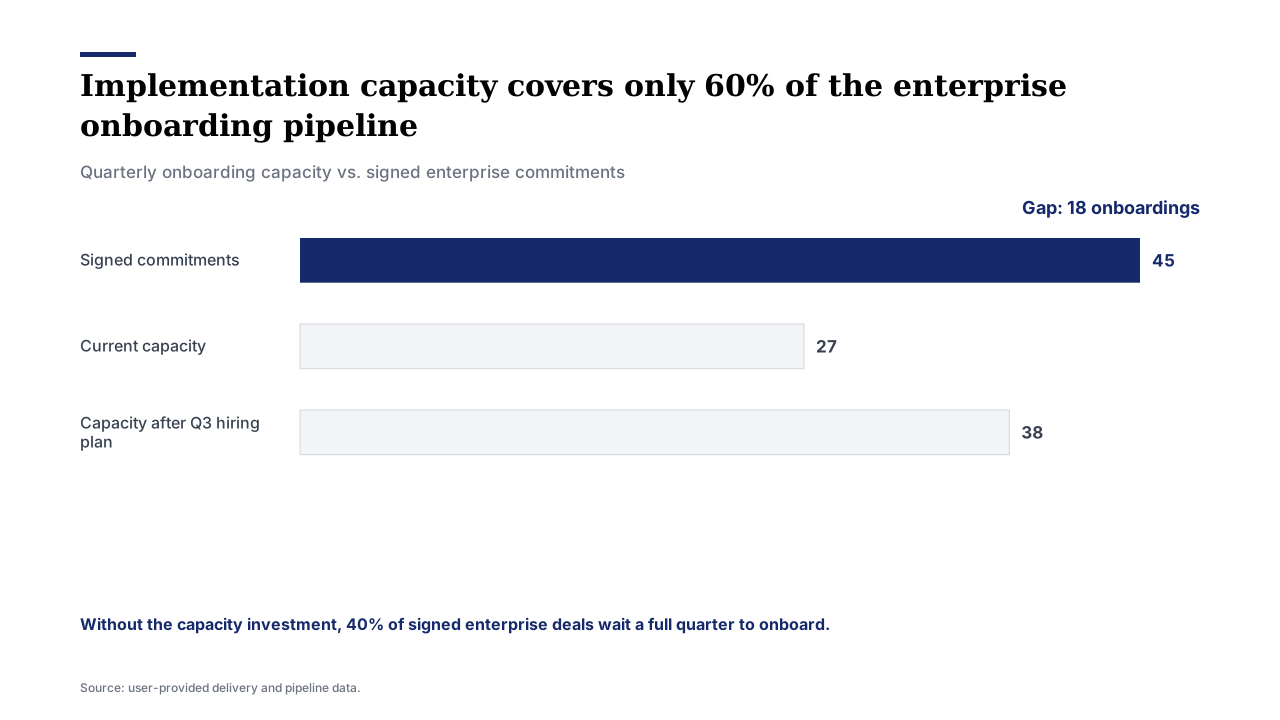 | 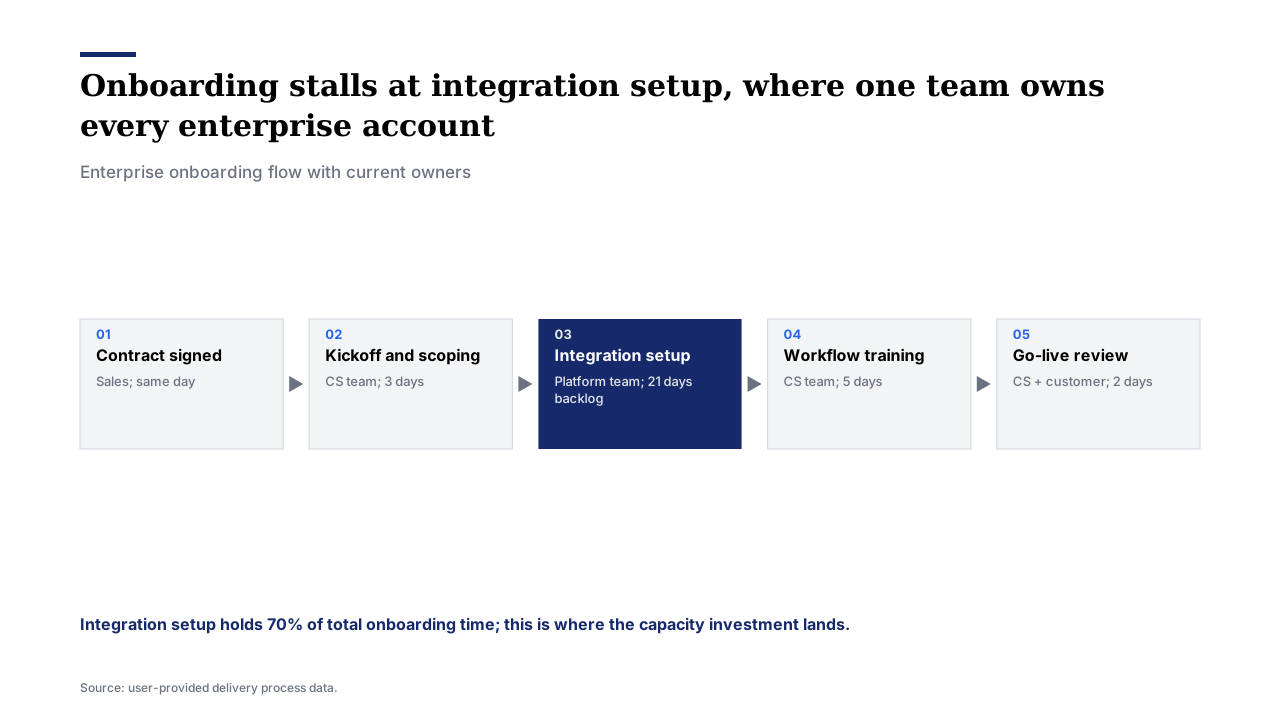 |
22 patterns render to SVG: cover, section_divider, end_cover, agenda, bullet_list, closing, quote, waterfall, gap, before_after, time_series, benchmark_table, summary_strip, process_flow, funnel, heatmap, gantt, kpi_scorecard, two_by_two, scatter, distribution, small_multiples. Thirteen more patterns (Sankey, pyramid, maps, decision trees, …) ship as structured specs and image-generation prompts — the catalog says exactly which is which. We don't pretend.
Animated HTML Decks
python3 scripts/build_html_deck.py cover.json bridge.json summary.json -o deck.html --title "Q4 Review"
One command, one file, and you get:
- Quiet, staggered element reveals on every slide — the restrained kind, not slide-carnival transitions (
prefers-reduced-motionrespected) - Keyboard + click navigation, progress bar, slide counter, deep links (
deck.html#3) - Print stylesheet:
por Cmd+P gives you one slide per page → save as PDF - Zero external requests — fonts, styles, scripts, and SVGs are all inline. Email it, host it, present offline.
Try the committed demo: examples/demo-deck.html (open locally after cloning).
Instant Deck: Scaffold → Build
Skip writing specs from a blank page. Pick an archetype, copy it, swap in real data:
File tree
More plugins by @kgraph57.
 View @kgraph57’s profile
FAQ
mckinsey-style-visualization-skill is a Claude Code plugin with 1 hand-picked skill for content work, indexed on Flowy. Install it with the command on its page. It includes mckinsey-style-visualization-skill. Its skills do not fire on their own yet. Request auto-invocation to have Flowy route them as you prompt. Free and open source.
- What is mckinsey-style-visualization-skill?
- Messy notes in. Board-ready slides out. One skill for your AI agent: turn notes, metrics, and prose into consulting-grade visuals — as real SVG slides, as an animated HTML deck, or as a spec any designer or tool can execute.
- How do I install mckinsey-style-visualization-skill?
- Run these in Claude Code: npx -y skills add kgraph57/mckinsey-style-visualization-skill --agent claude-code. Then prompt normally.
- Does mckinsey-style-visualization-skill auto-invoke its skills?
- Not yet. It is indexed on Flowy as a plain plugin. Request auto-invocation on its page and Flowy will route its skills for you as you prompt.
- Is mckinsey-style-visualization-skill free?
- Yes. Flowy is free and open source, with nothing gated. You can read every skill in full before you install.
Is this plugin yours?
Claim it with GitHubSubmit a pluginPromote it