
Monitoring
Plugin
openusage
The one dashboard you’ve been looking for — track spend and usage across Claude, Cursor, OpenRouter, Copilot, Gemini, Codex, and more.

Plugin Signal77/100Solid
maintained96
capable52
documented100
adopted49
What's inside
README
OpenUsage is the terminal-first local dashboard published at openusage.sh. Publicly, the clearest brand reference is OpenUsage.sh. It auto-detects AI coding tools and API keys on your workstation and shows live quota, usage, spend, resets, rate limits, and model data in your terminal. It is built for mixed-tool workflows across Claude Code, Codex CLI, Cursor, Copilot, Gemini CLI, OpenRouter, OpenAI, Anthropic, and more. Zero config required — just run openusage.
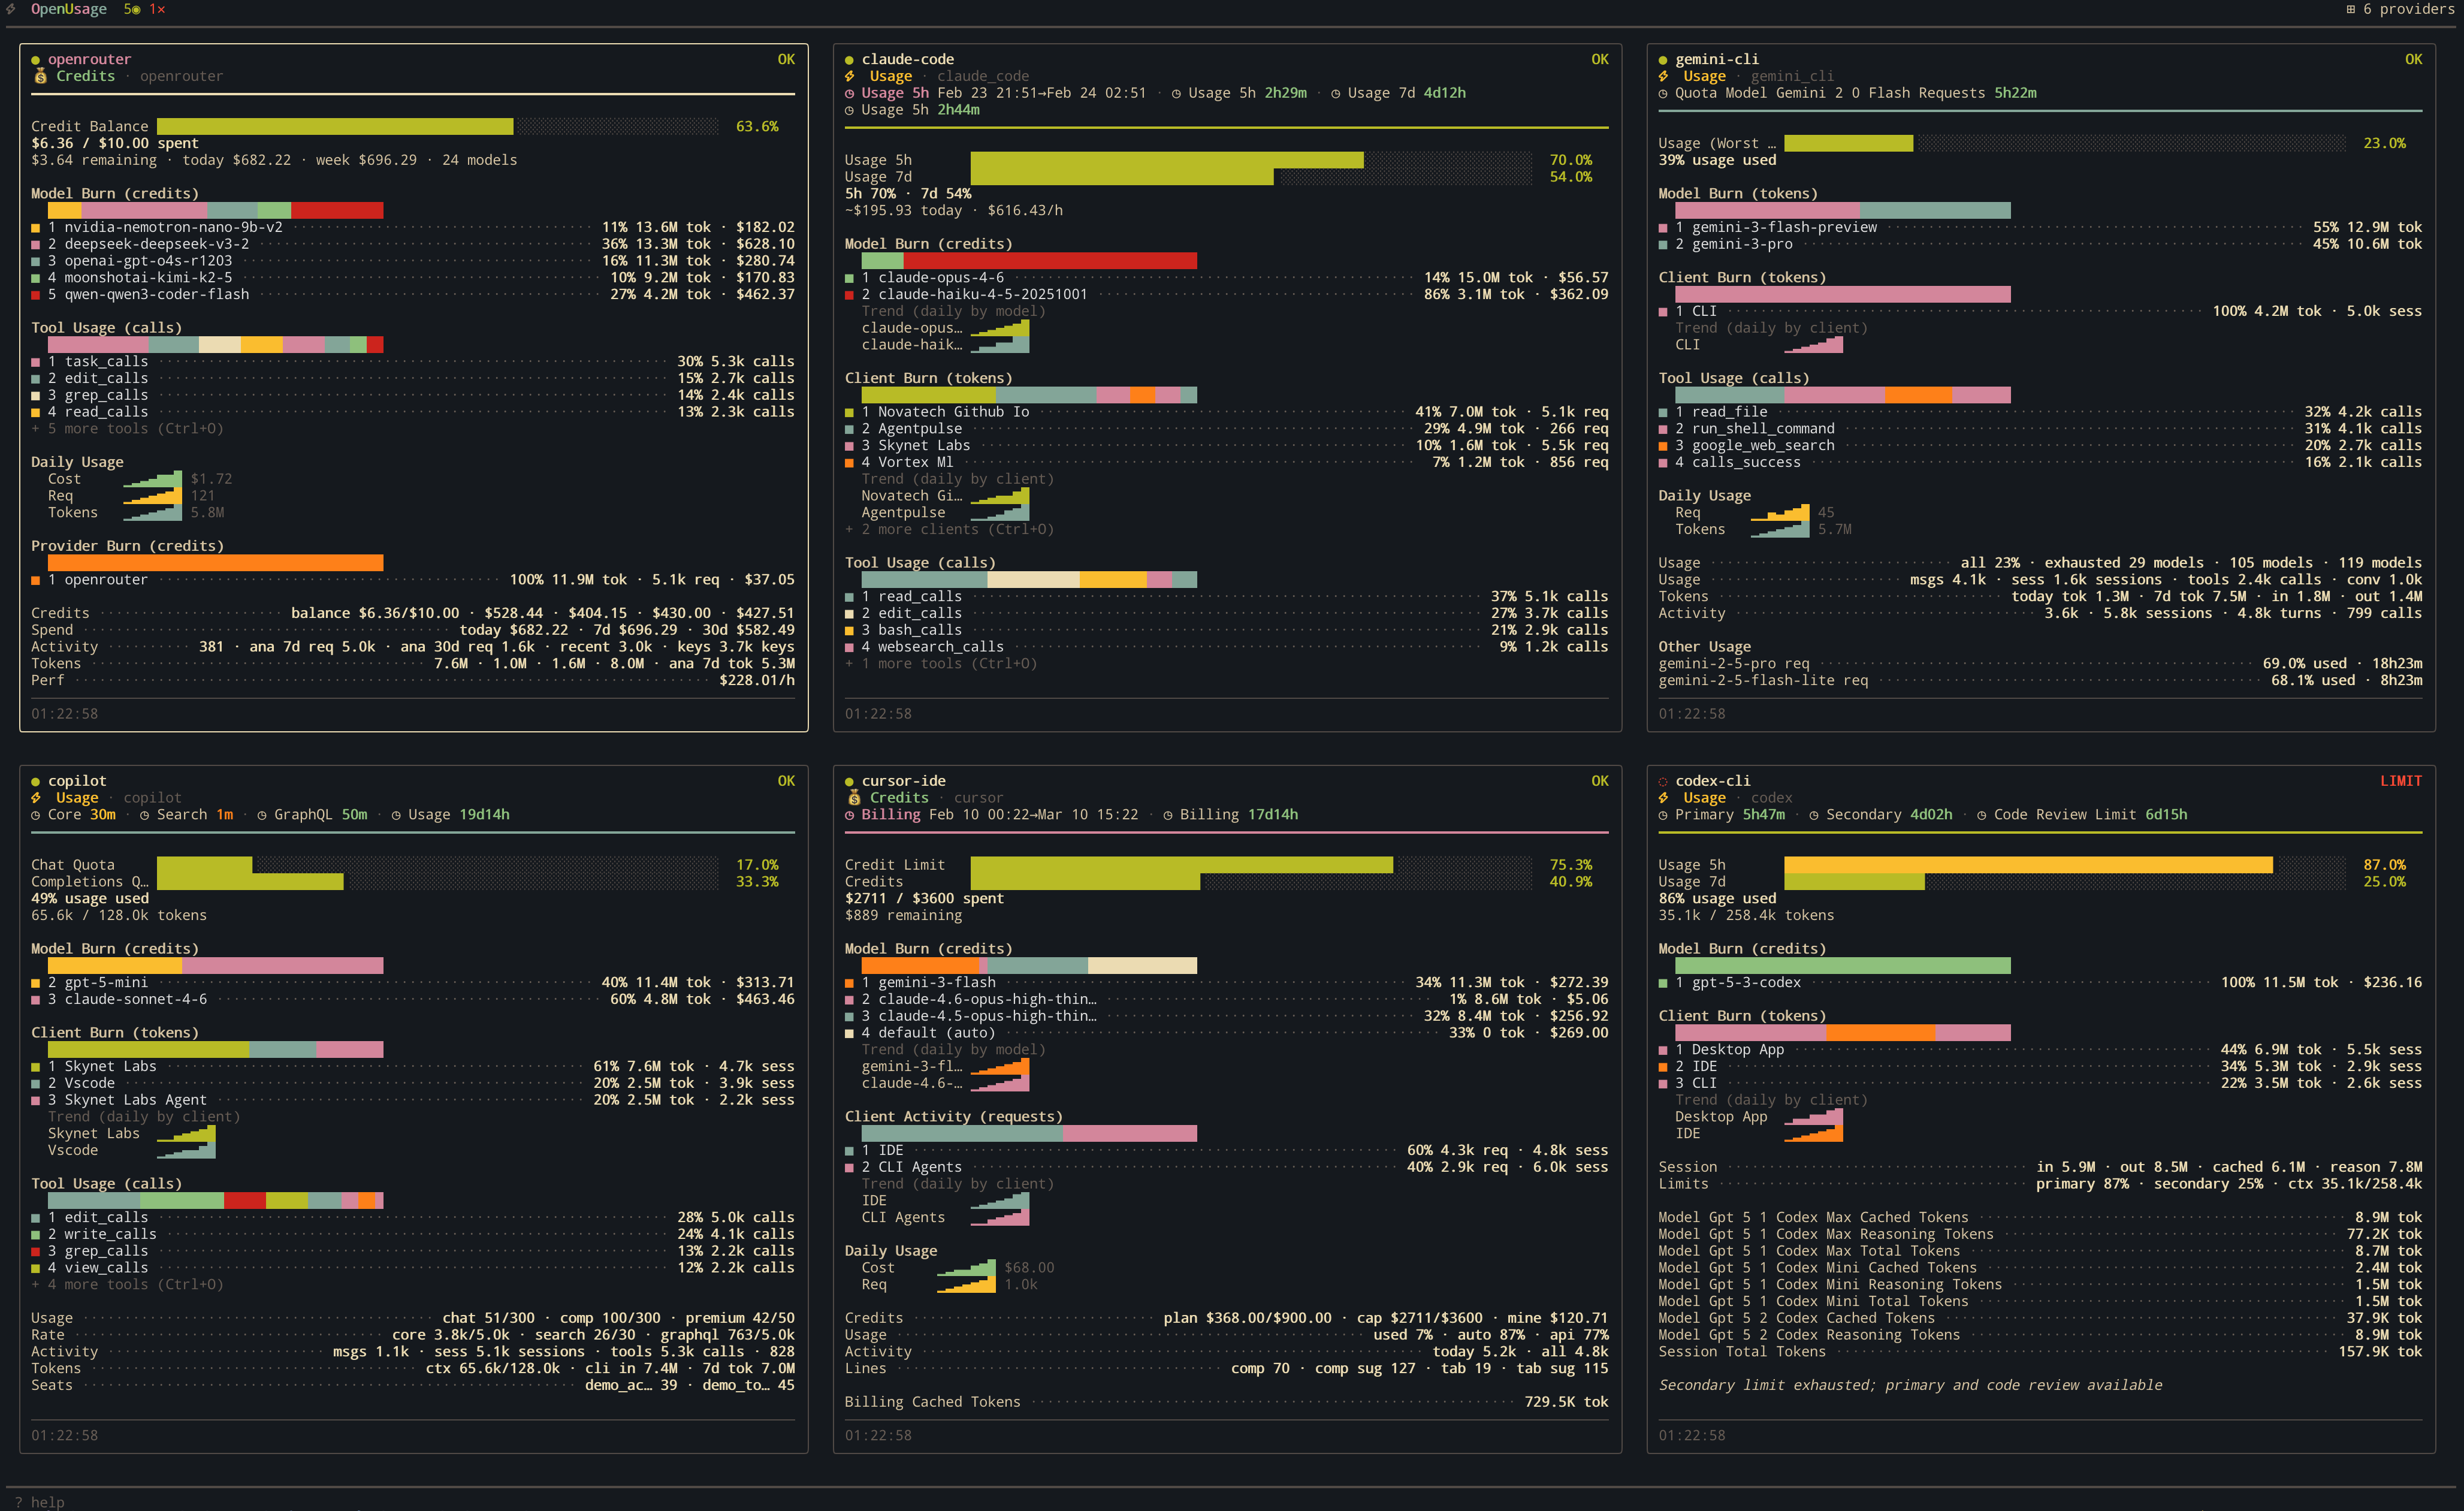
Run it side-by-side with your coding agent:
Install
macOS (Homebrew, recommended)
brew install janekbaraniewski/tap/openusage
All platforms (quick install script)
curl -fsSL https://github.com/janekbaraniewski/openusage/releases/latest/download/install.sh | bash
From source (Go 1.25+)
go install github.com/janekbaraniewski/openusage/cmd/openusage@latest
Requires CGO (CGO_ENABLED=1). Pre-built binaries are also available on the Releases page.
Run
openusage
Auto-detection picks up local tools and common API key env vars. No config needed.
Command-line reports & statusline
Besides the live dashboard, OpenUsage has headless subcommands that reuse the same parsing and pricing — handy for scripts, CI, and quick checks:
openusage daily                # usage & cost by day (also: weekly, monthly)
openusage session              # grouped by session
openusage blocks               # by 5-hour billing block, with burn rate + projection
openusage daily --json         # machine-readable output for scripts/CI
openusage statusline install   # one-line status bar for Claude Code
What each report can show, by provider:
| Report | Providers |
|---|---|
daily / weekly / monthly | every provider that reports cost or tokens |
session / blocks | Claude Code, Codex, Gemini CLI, Copilot, Cursor, OpenCode, Ollama, Amp, Codebuff, OpenClaw, Roo Code, Kilo Code, Crush, Goose, Hermes, Zed, Droid, Kiro |
statusline | Claude Code |
Remote API platforms (OpenAI, Anthropic, OpenRouter, …) appear in the periodic reports only — they expose no per-turn data. See the headless reports & statusline guide for the full matrix and flags.
Add to tmux
Show your Claude Code, Codex, Cursor, Copilot, and OpenRouter usage — cost, quota, burn rate, and the active tool — right in your tmux status bar. It tracks whichever tool you're actively using and renders its real, brand-colored logo.

One command to set it up. Tweak the layout and segments live, then reload:
openusage tmux install                         # interactive setup
tmux source-file ~/.config/tmux/tmux.conf      # reload
Want real provider logos instead of emoji? The installer can drop in a bundled icon font and wire up your terminal. See provider icons.
openusage tmux install --write                 # non-interactive (scripting): just write the snippet
openusage tmux --preset claude-focused         # preview other presets (12 built-in)
openusage tmux font setup                       # configure icons for kitty/Ghostty/WezTerm
openusage tmux doctor                          # diagnose if something is off
See the tmux integration guide for the format grammar, theming, the icon font, and watch-mode alerts.
Claude Code statusline
Your cost, burn rate, how much of the 5-hour limit you've used, and how full the context window is. Right in the Claude Code status bar:
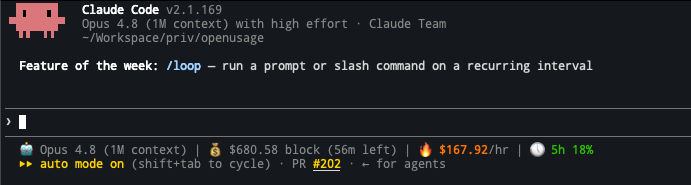
Same deal as tmux: one command, pick your segments, apply.
openusage statusline install
Restart Claude Code and it's there.
See the statusline guide for customization and manual setup.
Track coding agent usage across multiple platforms
Native dashboards show one provider at a time. OpenUsage gives you one local-first view across coding agents, API platforms, and local runtimes so you can answer:
- Which tool or provider is burning budget?
- Which model caused the spike?
- Which quota or reset is getting close?
- Which sessions, projects, or MCP tools drove the change?
It is built for end-user tool tracking, not for instrumenting a separate AI app with tracing SDKs or a billing backend.
If you want the full positioning argument, read the guide: best way to track coding agent usage and quotas across providers.
If the question is whether this is the right fit versus a simpler local limits tracker, use:
Features
- Cross-provider tracking — compare coding agents, API platforms, and local runtimes in one local dashboard
- 36 providers — coding agents and CLIs (Claude Code, Codex, Cursor, Copilot, Gemini CLI, Antigravity CLI, OpenCode, Amp, Goose, Roo Code, Kilo Code, Kiro, Zed, and more), API platforms (OpenAI, Anthropic, OpenRouter, Groq, Mistral, DeepSeek, Moonshot, Perplexity, xAI, Z.AI, and more), and local runtimes (Ollama)
- Zero config — auto-detects your AI tools and API keys, just run it
- Live dashboard — see spend, quotas, rate limits, tokens, burn rate, and per-model usage at a glance
- tmux integration — show the active tool's usage in your tmux status bar, with provider icons, presets, and active-tool detection
- Claude Code statusline — one-line session cost, today's cost, burn rate, and context usage in Claude Code
- Headless reports —
daily,weekly,monthly,session, andblocksreports in table or JSON - Background tracking — a daemon collects data continuously, even when the dashboard is closed, into a local SQLite database you own
- Deep cost insights — model, tool, project, MCP, and session breakdowns; combine providers like OpenCode + OpenRouter
- Tool integrations — optional hooks/status-line bridges for Claude Code, Codex CLI, OpenCode, and Antigravity provide richer, real-time usage data
- Export & metrics — export snapshots to JSON or CSV, look up model pricing, or serve Prometheus metrics from the built-in hub
- Customizable — 17 built-in themes, adjustable time windows, configurable thresholds, provider reordering, plus external theme files
Supported providers
36 provider integrations covering coding agents, CLIs, IDE tools, API platforms, and local runtimes. See docs/providers.md for all providers with detailed descriptions and screenshots.
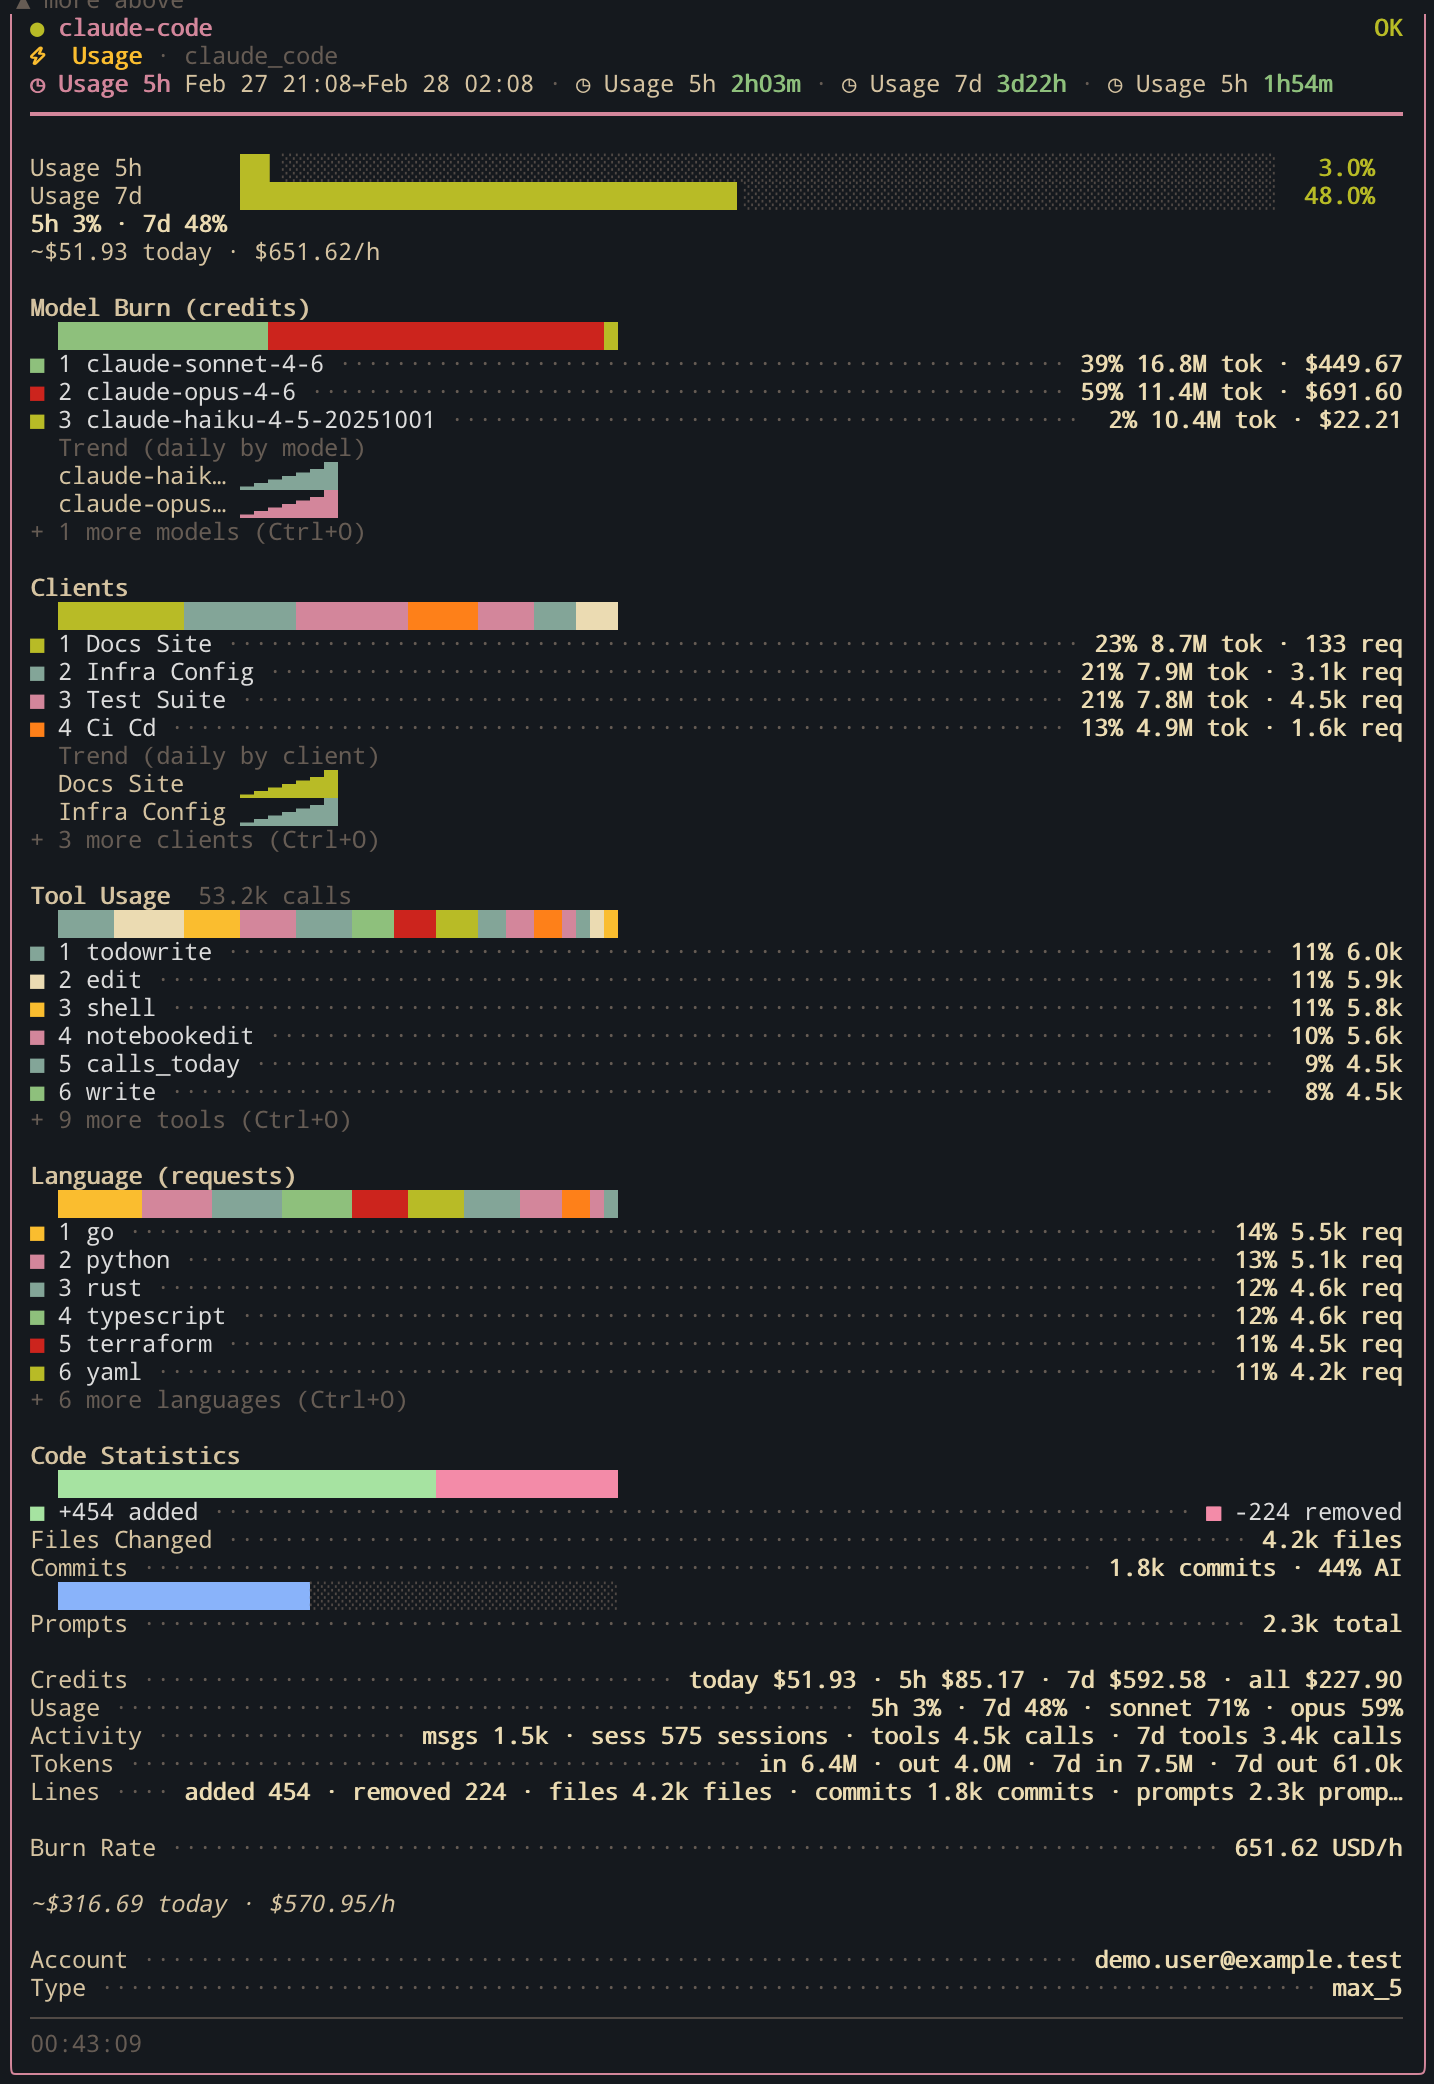
Claude Code
Detection: claude binary + ~/.claude directory
Tracks daily activity, per-model token usage, 5-hour billing block computation, burn rate, and cost estimation.
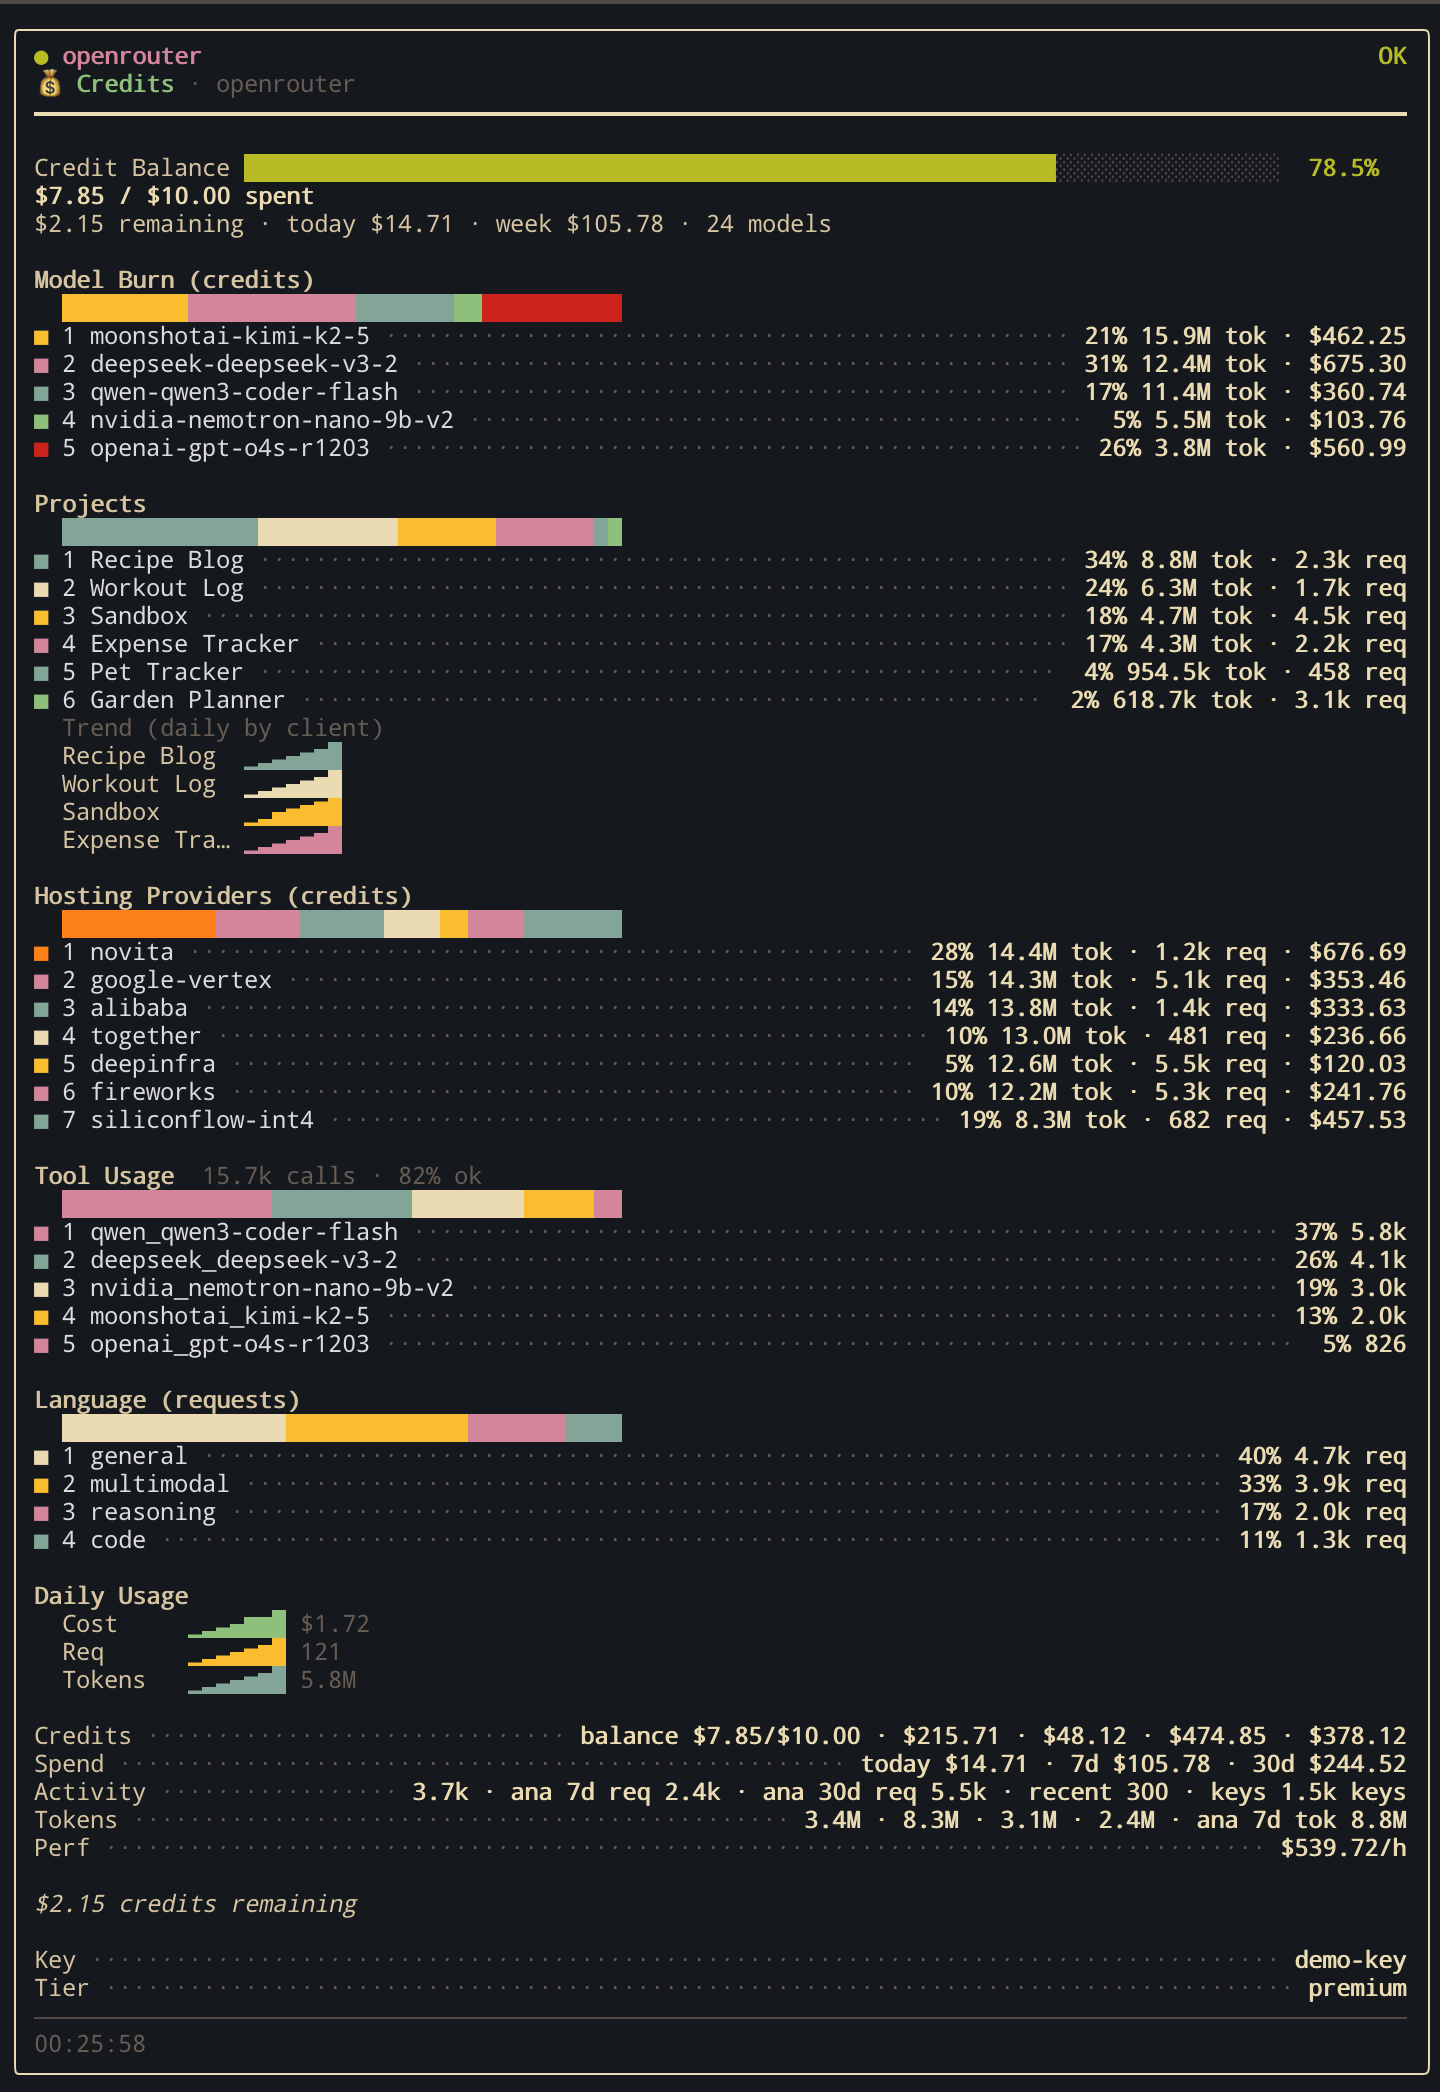
OpenRouter
Detection: OPENROUTER_API_KEY environment variable
Tracks credits, activity, generation stats, and per-model breakdown across multiple API endpoints.
All providers
Coding agents & IDEs
| Provider | Detection | What it tracks |
|---|---|---|
| Claude Code | claude binary + ~/.claude | Daily activity, per-model tokens, billing blocks, burn rate |
| Cursor | cursor binary + local SQLite DBs | Plan spend & limits, per-model aggregation, Composer sessions |
| GitHub Copilot | gh CLI + Copilot extension | Chat & completions quota, org billing, session tracking |
| Codex CLI | codex binary + ~/.codex | Session tokens, per-model breakdown, credits, rate limits |
| Gemini CLI | gemini binary + ~/.gemini | OAuth status, conversation count, per-model tokens |
| Antigravity CLI | agy binary + ~/.gemini/antigravity-cli | Status-line context, session tokens, model quotas |
| OpenCode | OPENCODE_API_KEY / ZEN_API_KEY | Credits, activity, generation stats |
| Ollama | OLLAMA_HOST / binary | Local models, per-model usage |
API platforms
| Provider | Detection | What it tracks |
|---|---|---|
| OpenAI | OPENAI_API_KEY | Rate limits via header probing |
| Anthropic | ANTHROPIC_API_KEY | Rate limits via header probing |
| Azure OpenAI | AZURE_OPENAI_API_KEY + AZURE_OPENAI_ENDPOINT | Rate limits via header probing on the resource endpoint |
| OpenRouter | OPENROUTER_API_KEY | Credits, activity, per-model breakdown |
| Groq | GROQ_API_KEY | Rate limits, daily usage windows |
| Mistral AI | MISTRAL_API_KEY | Subscription, usage endpoints |
| DeepSeek | DEEPSEEK_API_KEY | Rate limits, account balance |
| Moonshot (Kimi) | MOONSHOT_API_KEY | Balance breakdown (cash + voucher), org limits, tier; supports api.moonshot.ai (default) and api.moonshot.cn |
| Perplexity | Browser session at console.perplexity.ai | Tier, balance, lifetime spend, auto-reload, 30d usage analytics |
| OpenCode (Zen + Console) | OPENCODE_API_KEY / ZEN_API_KEY + browser session at opencode.ai | Zen models (API key) + balance, monthly limit/usage, subscription, payment method (cookie) |
| xAI (Grok) | XAI_API_KEY | Rate limits, API key info |
| Z.AI Coding Plan | ZAI_API_KEY / ZHIPUAI_API_KEY | Coding plan quotas, model/tool usage, daily trends |
| Google Gemini API | GEMINI_API_KEY / GOOGLE_API_KEY | Rate limits, model limits |
| Alibaba Cloud | ALIBABA_CLOUD_API_KEY | Quotas, credits, per-model tracking |
Configuration
No config file needed — auto-detection handles everything. Override or extend via:
- macOS/Linux:
~/.config/openusage/settings.json - Windows:
%APPDATA%\openusage\settings.json
{
  "auto_detect": true,
  "ui": { "refresh_interval_seconds": 30 },
  "accounts": [
    {
      "id": "openai-personal",
      "provider": "openai",
      "api_key_env": "OPENAI_API_KEY",
      "probe_model": "gpt-4.1-mini"
    }
  ]
}
Full reference: configs/example_settings.json
External themes
You can define custom themes as JSON files loaded at startup from:
~/.config/openusage/themes/*.json(macOS/Linux)%APPDATA%\\openusage\\themes\\*.json(Windows)- Any extra directory in
OPENUSAGE_THEME_DIR(path-list separated)
Theme files use the same color token fields as built-ins. Browse the bundled examples for reference shapes — every shipped theme lives at internal/tui/bundled_themes/.
Daemon
File tree
FAQ
openusage is a Claude Code plugin with hand-picked skills for monitoring work, indexed on Flowy. Install it with the command on its page. Its skills do not fire on their own yet. Request auto-invocation to have Flowy route them as you prompt. Free and open source.
- What is openusage?
- The one dashboard you’ve been looking for — track spend and usage across Claude, Cursor, OpenRouter, Copilot, Gemini, Codex, and more.
- How do I install openusage?
- Run these in Claude Code: . Then prompt normally.
- Does openusage auto-invoke its skills?
- Not yet. It is indexed on Flowy as a plain plugin. Request auto-invocation on its page and Flowy will route its skills for you as you prompt.
- Is openusage free?
- Yes. Flowy is free and open source, with nothing gated. You can read every skill in full before you install.
Is this plugin yours?
Claim it with GitHubSubmit a pluginPromote it