
Data
Plugin
chartli
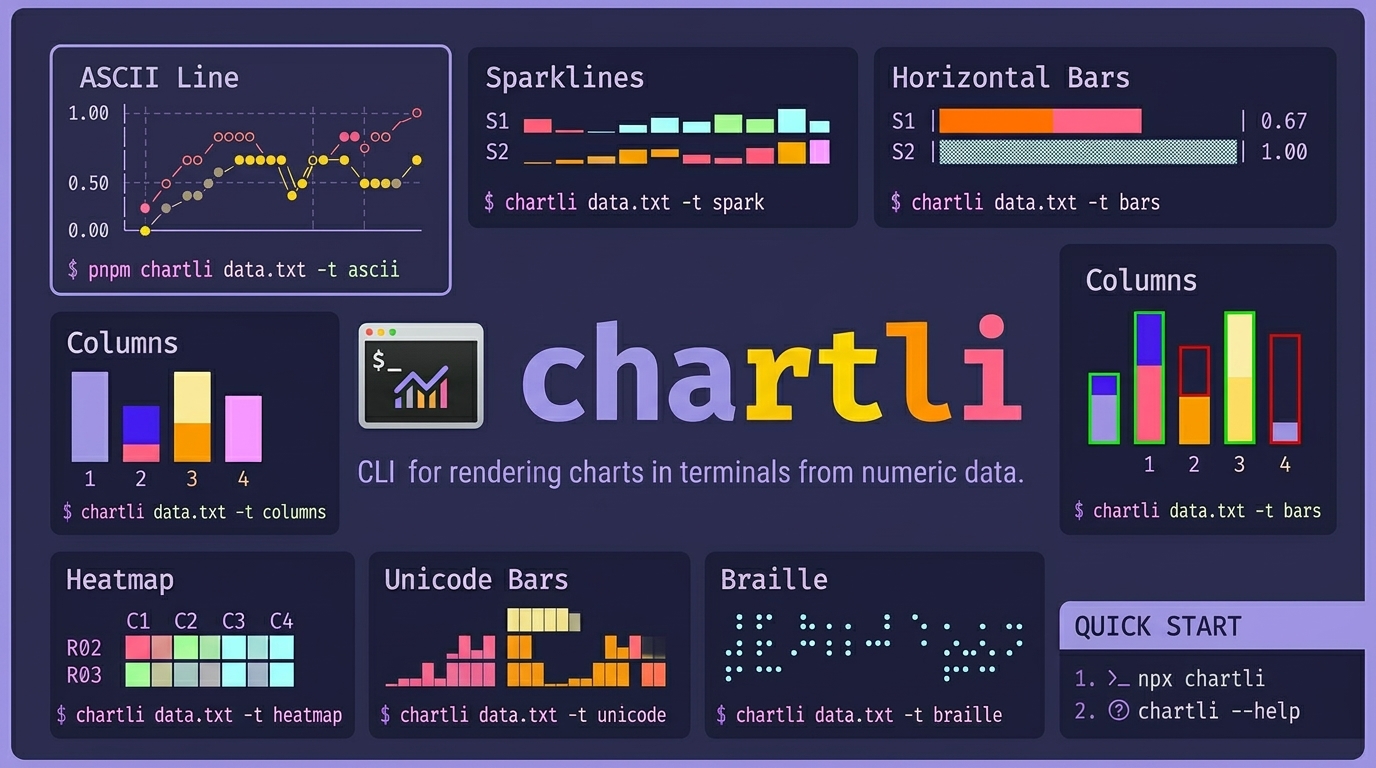
CLI for rendering charts in terminals from numeric text data. chartli turns plain numbers into terminal charts. ascii, spark, bars, columns, heatmap, unicode, braille, svg.

Plugin Signal41/100Fair
maintained22
capable14
documented100
adopted62
Install
$ npx -y skills add ahmadawais/chartli --agent claude-code
Stats
791
Stars
47
Forks
Quiet
Maintenance
TypeScript
Language
6mo ago
Last commit
6mo ago
Created
Repo: ahmadawais/chartli
What's inside
Badges
README
chartli
CLI for rendering charts in terminals from numeric text data. chartli turns plain numbers into terminal charts. ascii, spark, bars, columns, heatmap, unicode, braille, svg.
Install
Run instantly:
npx chartli --help
Or install globally:
npm i -g chartli
Agent skill install
Install the repository skill for agents:
npx skills add ahmadawais/chartli
Quick start:
npx chartli
npx chartli --help
Usage
npx chartli [file] [options]
Usage: chartli [options] [file]

Render terminal charts from numeric data

Arguments:
  file                   Input file (reads from stdin if not provided)

Options:
  -v, --version          Output the version number
  -t, --type <type>      Chart type: svg, ascii, unicode, braille, spark, bars,
                         columns, heatmap (default: "ascii")
  -w, --width <number>   Chart width
  -h, --height <number>  Chart height
  -m, --mode <mode>      SVG mode: circles or lines (default: "circles")
  --x-axis-label <label> Title to render for the x-axis
  --y-axis-label <label> Title to render for the y-axis
  --x-labels <labels>    Comma-separated labels for x-axis ticks or row labels
  --series-labels <labels>
                         Comma-separated labels for plotted series or categories
  --data-labels          Show raw values near plotted data when supported
  --first-column-x       Treat the first numeric column as x labels instead of a
                         plotted series
  --help                 Display help for command
Labels and metadata
- Use
--x-axis-labeland--y-axis-labelto add axis titles. - Use
--x-labelsfor explicit tick labels. - Use
--series-labelsto replace generic labels likeS1andC1. - Use
--data-labelsto print raw values on or near the plotted data where the renderer supports it. - Use
--first-column-xwhen the first numeric column is a domain likeday,month, oryear.
With --first-column-x, chartli will:
- use the first numeric column as x-axis labels
- use the first header cell as the x-axis title when a header row exists
- use the remaining header cells as series labels
- use the second header cell as the y-axis title for common two-column data
Example:
pnpm chartli examples/assets/core-single-series.txt -t ascii -w 24 -h 8 --first-column-x --data-labels
pnpm chartli examples/assets/core-multi-series.txt -t columns -h 8 --first-column-x --series-labels sales,costs,profit --x-axis-label Metrics --y-axis-label Value --data-labels
Labeled chart examples
ASCII line with inferred axis labels and data labels
pnpm chartli examples/assets/weekly-signups.txt -t ascii -w 28 -h 8 --first-column-x --data-labels
        signups
    91 │                      ●   87
       │                     91    ●
       │            73
       │             ●   68
  66.5 │   58             ●
       │    ●   49
       │42       ●
    42 │●
       └────────────────────────────
        1   2    3   4    5   6    7
                    day
Columns with explicit axis titles and inferred series names
pnpm chartli examples/assets/weekly-metrics.txt -t columns -h 8 --first-column-x --x-axis-label Metrics --y-axis-label Count --data-labels
Count
 176     29     10


  █
  █
  █
  █
  █      ▓      ▒
  █      ▓      ▒
────────────────────
visits trials  paid
      Metrics
SVG with axes, x labels, and point labels
pnpm chartli examples/assets/weekly-signups.txt -t svg -m lines -w 320 -h 120 --first-column-x --data-labels | sed -n '/^<?xml/,$p' > examples/assets/output/weekly-signups-chart.svg
This writes examples/assets/output/weekly-signups-chart.svg.
Types
asciisparkbarscolumnsheatmapunicodebraillesvg
Example data files
examples/assets/core-single-series.txtexamples/assets/core-multi-series.txtexamples/assets/image-data.txtexamples/assets/image-single-series.txtexamples/assets/image-columns-variant.txtexamples/assets/weekly-signups.txtexamples/assets/weekly-metrics.txt
Image chart set (text diagrams)
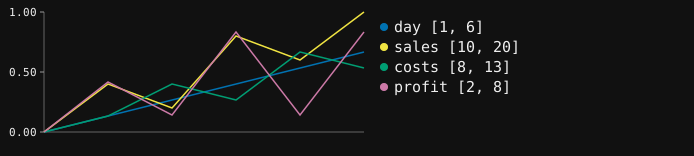
ASCII Line
pnpm chartli examples/assets/image-data.txt -t ascii -w 24 -h 8
      day=●  sales=○  costs=◆  profit=◇
1.00 │                       ○
     │
     │             ◇         ◇
     │                  ◆    ●
0.50 │                  ●    ◆
     │    ◇    ◆   ●
     │         ○   ◆
0.00 │◇   ◆    ◇        ◇
     └────────────────────────
Sparklines
pnpm chartli examples/assets/image-data.txt -t spark
day    ▁▂▃▄▅▆
sales  ▁▄▂▇▅█
costs  ▁▂▄▃▆▅
profit ▁▄▂▇▂▇
Horizontal Bars
pnpm chartli examples/assets/image-data.txt -t bars -w 28
day    |███████████████████         | 0.67
sales  |▓▓▓▓▓▓▓▓▓▓▓▓▓▓▓▓▓▓▓▓▓▓▓▓▓▓▓▓| 1.00
costs  |▒▒▒▒▒▒▒▒▒▒▒▒▒▒▒             | 0.53
profit |░░░░░░░░░░░░░░░░░░░░░░░     | 0.83
Columns
pnpm chartli examples/assets/image-data.txt -t columns -h 8
         ▓
         ▓             ░
         ▓             ░
  █      ▓             ░
  █      ▓      ▒      ░
  █      ▓      ▒      ░
  █      ▓      ▒      ░
  █      ▓      ▒      ░
───────────────────────────
 day   sales  costs  profit
Columns (Variant)
pnpm chartli examples/assets/image-columns-variant.txt -t columns -h 8
         ▓             ░
  █      ▓             ░
  █      ▓             ░
  █      ▓      ▒      ░
  █      ▓      ▒      ░
  █      ▓      ▒      ░
───────────────────────────
 day   sales  costs  profit
Heatmap
pnpm chartli examples/assets/image-data.txt -t heatmap
    day sales costs profit
R01
R02 ░ ▒ ░ ▒
R03 ░ ░ ▒ ░
R04 ▒ ▓ ░ ▓
R05 ▒ ▒ ▓ ░
R06 ▓ █ ▒ ▓
Unicode Bars
pnpm chartli examples/assets/image-data.txt -t unicode
 day    sales   costs   profit
             █
           ▃ █             ▅ ▅
     ▃     █ █      ▃      █ █
    ▂█     █▆█      █▂     █ █
   ▂██   ▂ ███    ▂ ██   ▃ █ █
  ▁███   █ ███    █▁██   █ █ █
 ▁████   █▅███   ▁████   █▁█▁█
 █████   █████   █████   █████
Braille
pnpm chartli examples/assets/image-data.txt -t braille -w 16 -h 6
profit

⠀⠀⠀⠀⠀⠀⠀⠀⠀⠀⠀⠀⠀⠀⠀⠀
⠀⠀⠀⠀⠀⠀⠀⠀⠀⠁⠀⠀⠀⠀⠀⠈
⠀⠀⠀⠀⠀⠀⠀⠀⠀⠀⠀⠀⠀⠀⠀⠀
⠀⠀⠀⠄⠀⠀⠀⠀⠀⠀⠀⠀⠀⠀⠀⠀
⠀⠀⠀⠀⠀⠀⠀⠀⠀⠀⠀⠀⠀⠀⠀⠀
⡀⠀⠀⠀⠀⠀⠁⠀⠀⠀⠀⠀⠁⠀⠀⠀
SVG Chart
pnpm chartli examples/assets/image-data.txt -t svg -m lines -w 320 -h 120 | sed -n '/^<?xml/,$p' > examples/assets/output/image-chart.svg
<?xml version='1.0'?>
<svg xmlns='http://www.w3.org/2000/svg' width='650' height='120' version='1.1'>
  <polyline ... />
  <polyline ... />
  <polyline ... />
  <polyline ... />
</svg>
Examples
All examples are data-file driven from examples/assets/.
Data files
examples/assets/core-single-series.txtexamples/assets/core-multi-series.txtexamples/assets/image-data.txtexamples/assets/image-single-series.txtexamples/assets/image-columns-variant.txtexamples/assets/weekly-signups.txtexamples/assets/weekly-metrics.txtexamples/assets/output/
Core commands
pnpm chartli examples/assets/core-single-series.txt -t ascii -w 24 -h 8pnpm chartli examples/assets/core-multi-series.txt -t sparkpnpm chartli examples/assets/core-multi-series.txt -t bars -w 28pnpm chartli examples/assets/core-multi-series.txt -t columns -h 8pnpm chartli examples/assets/core-multi-series.txt -t heatmappnpm chartli examples/assets/core-multi-series.txt -t unicodepnpm chartli examples/assets/core-single-series.txt -t braille -w 16 -h 6pnpm chartli examples/assets/core-multi-series.txt -t svg -m lines -w 320 -h 120 | sed -n '/^<?xml/,$p' > examples/assets/output/core-chart.svg
Image commands
pnpm chartli examples/assets/image-data.txt -t ascii -w 24 -h 8pnpm chartli examples/assets/image-data.txt -t sparkpnpm chartli examples/assets/image-data.txt -t bars -w 28pnpm chartli examples/assets/image-data.txt -t columns -h 8pnpm chartli examples/assets/image-columns-variant.txt -t columns -h 8pnpm chartli examples/assets/image-data.txt -t heatmappnpm chartli examples/assets/image-data.txt -t unicodepnpm chartli examples/assets/image-data.txt -t braille -w 16 -h 6pnpm chartli examples/assets/image-data.txt -t svg -m lines -w 320 -h 120 | sed -n '/^<?xml/,$p' > examples/assets/output/image-chart.svg
Labeled commands
pnpm chartli examples/assets/weekly-signups.txt -t ascii -w 28 -h 8 --first-column-x --data-labelspnpm chartli examples/assets/weekly-metrics.txt -t columns -h 8 --first-column-x --x-axis-label Metrics --y-axis-label Count --data-labelspnpm chartli examples/assets/weekly-signups.txt -t svg -m lines -w 320 -h 120 --first-column-x --data-labels | sed -n '/^<?xml/,$p' > examples/assets/output/weekly-signups-chart.svg
Run grouped examples
pnpm run example:kitchen-sinkpnpm run example:image-set:kitchen-sinkpnpm run example:labeled:kitchen-sinkpnpm run example:all-kitchen-sink
Run all examples
Image-set chart run:
pnpm run example:image-set:kitchen-sink
Core + image run:
pnpm run example:all-kitchen-sink
License
Apache-2.0 by Ahmad Awais built with Command Code.
File tree
FAQ
chartli is a Claude Code plugin with 1 hand-picked skill for data work, indexed on Flowy. Install it with the command on its page. It includes chartli. Its skills do not fire on their own yet. Request auto-invocation to have Flowy route them as you prompt. Free and open source.
- What is chartli?
- CLI for rendering charts in terminals from numeric text data. chartli turns plain numbers into terminal charts. ascii, spark, bars, columns, heatmap, unicode, braille, svg.
- How do I install chartli?
- Run these in Claude Code: npx -y skills add ahmadawais/chartli --agent claude-code. Then prompt normally.
- Does chartli auto-invoke its skills?
- Not yet. It is indexed on Flowy as a plain plugin. Request auto-invocation on its page and Flowy will route its skills for you as you prompt.
- Is chartli free?
- Yes. Flowy is free and open source, with nothing gated. You can read every skill in full before you install.
Is this plugin yours?
Claim it with GitHubSubmit a pluginPromote it