
Monitoring
Plugin
clawmetry
An agent can make a hundred tool calls without making progress.

Plugin Signal67/100Solid
maintained100
capable29
documented75
adopted56
Install
$ npx -y skills add vivekchand/clawmetry --agent claude-code
Stats
429
Stars
72
Forks
Active
Maintenance
Python
Language
MIT
License
6h ago
Last commit
8mo ago
Created
2h ago
Added
In this plugin
See everything inside What's inside
Skill(2 skills)
/clawmetryReal-time observability for OpenClaw agents — local dashboard + optional encrypted cloud sync. Tracks costs, tokens, sessions, tool calls, memory, crons, and system health. Access from anywhere via ClawMetry Cloud./agent-kill-switchGive the human an off switch and a cost meter for the coding agents on this machine, using ClawMetry. Use when the user asks to stop or kill a runaway agent, see what an agent is doing or spending, cap agent spend, gate risky tool calls behind approval, or "set up a kill switch"
MCP(1 mcp)
Badges





README
ClawMetry
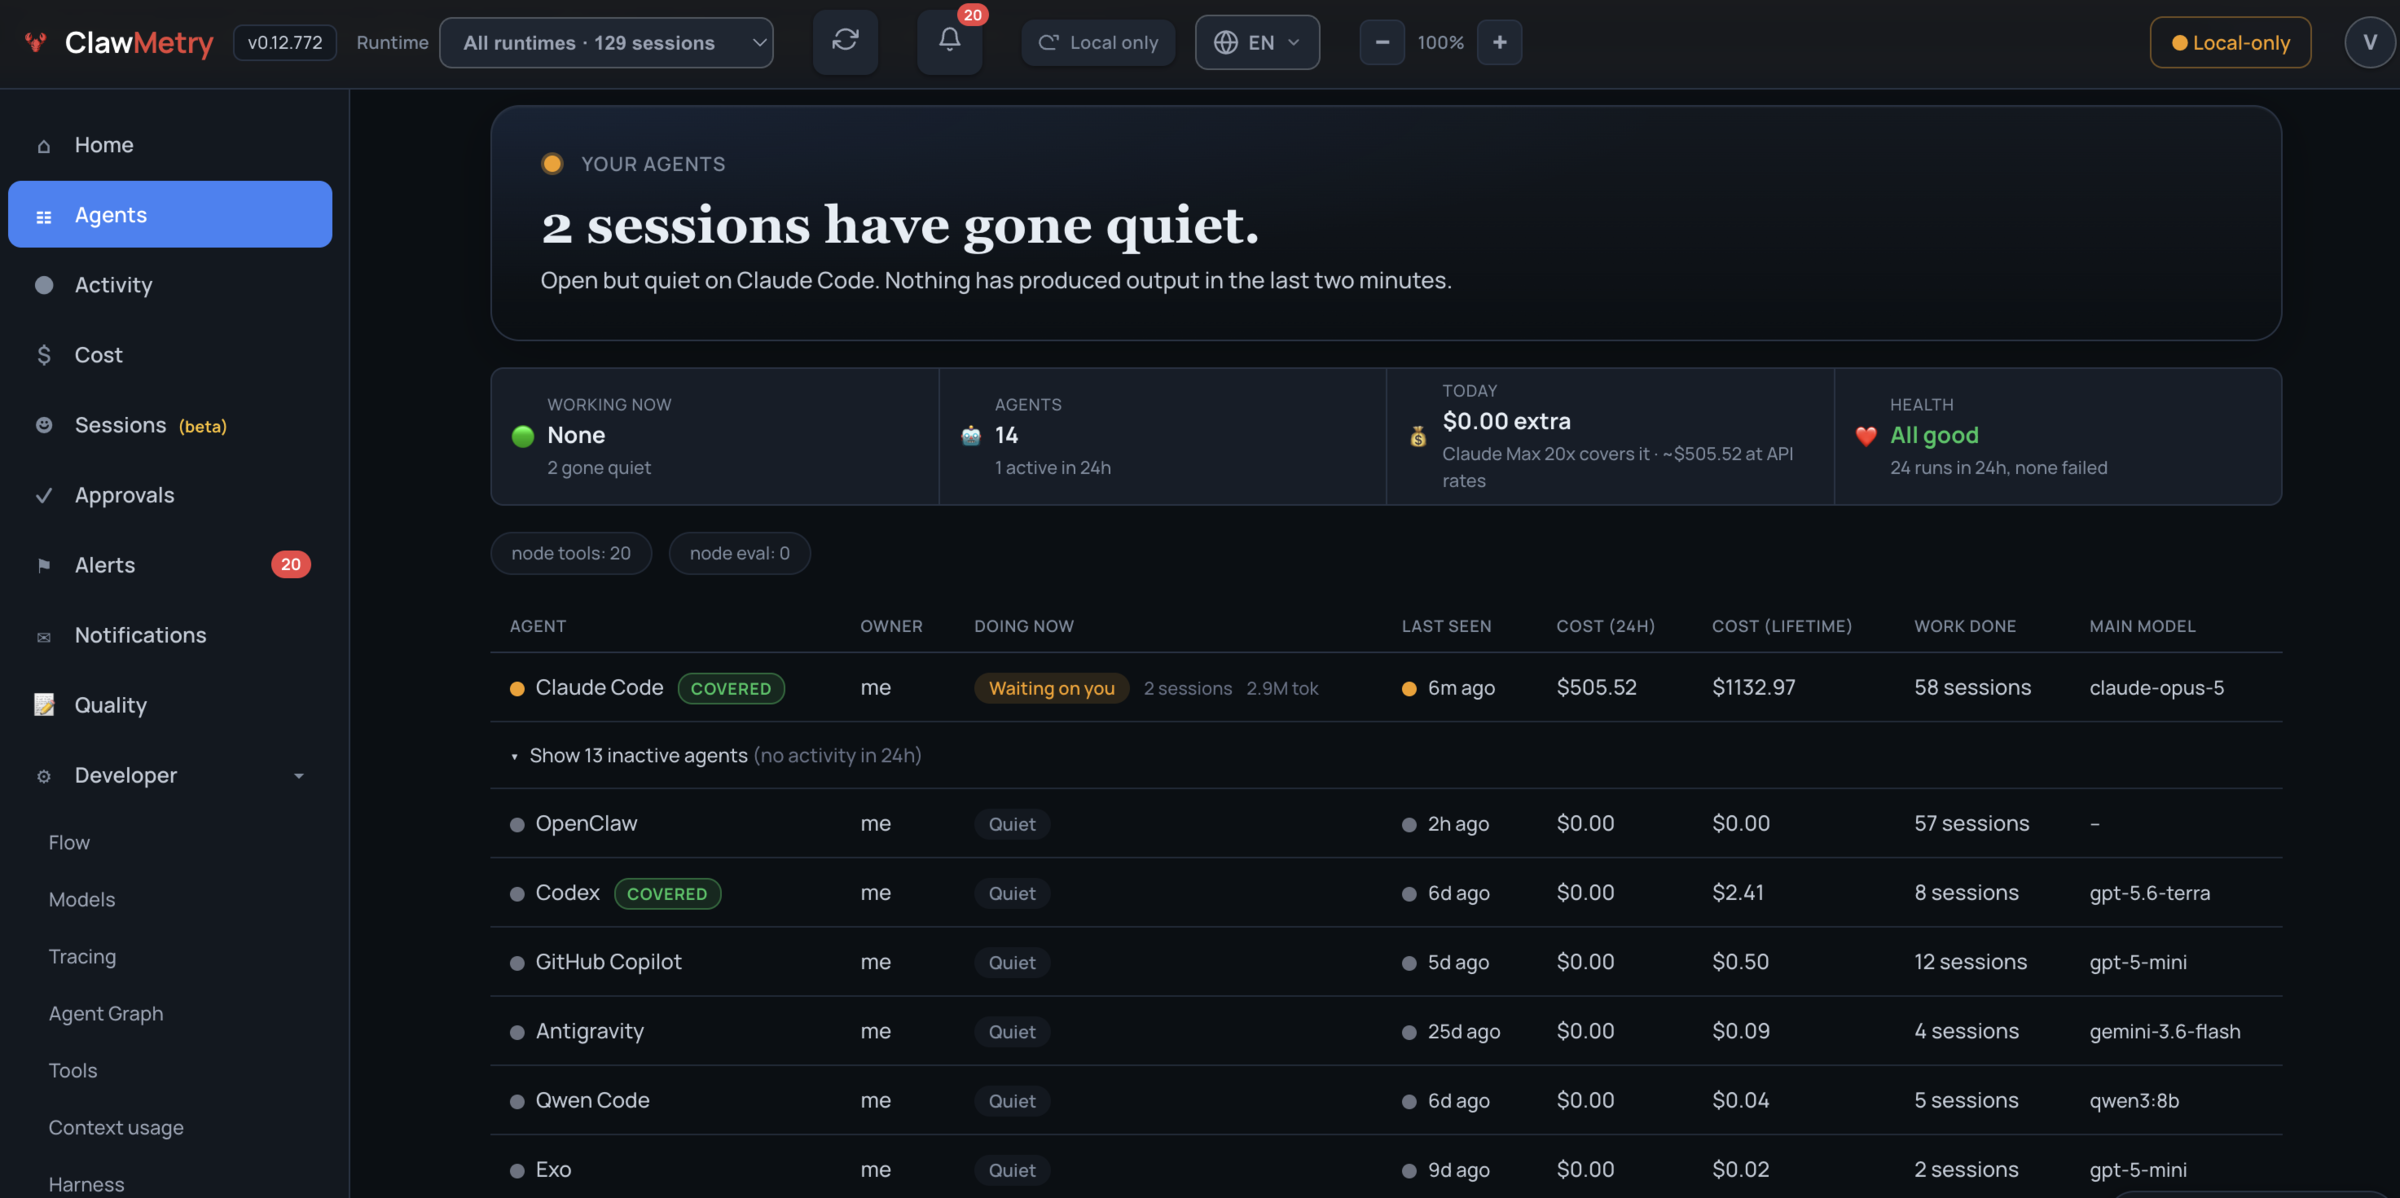
An agent can make a hundred tool calls without making progress. ClawMetry reads the session files your coding agents already write, and puts the timeline, the tool calls and whatever token and cost data the runtime exposes into one view — so you can tell a long run that is working from one that is stuck.
Works with 33 AI agent runtimes — Claude Code, OpenAI Codex, Hermes, OpenClaw & 29 more. One dashboard for your whole agent fleet. (the full list, generated from the catalogue.)
🌐 Read this in: English · 简体中文 · 日本語 · 한국어 · Español · Português (BR) · Français · Deutsch · हिन्दी · العربية · Русский · more →
One command. Zero config. Auto-detects everything.
pip install clawmetry && clawmetry
Opens at http://localhost:8900. Zero config: it finds the agent runtimes you already have, reads them read-only, and changes nothing about how they run.
Before you install
| What it does | Reads the session files and logs your agents already write. No SDK, no code change, no instrumentation in your app. |
| What you see | Session timeline, tool-by-tool replay, token and cost breakdown, and trajectory signals (looping, repeated failures) — per runtime. |
| What's free | pip install clawmetry reads OpenClaw, NVIDIA NemoClaw, Goose and Qwen Code with no account, no key and no network call. The other 28 — Claude Code, Codex, Cursor and the rest — are read by the closed-source clawmetry-pro companion, which arrives with the 7-day trial or a plan — see docs/ENTITLEMENTS.md for the exact split. |
| How to start | pip install clawmetry && clawmetry, then open localhost:8900. No agents on this machine yet? clawmetry --sample opens on three labelled synthetic sessions. |
| What leaves your machine | No session data, unless you run clawmetry connect. Two things do run by default, both opt-out and neither carrying session content: an anonymous install ping and a PyPI version check. Every destination is inventoried in docs/EGRESS.md, rebuilt from a wire capture rather than from reading comments. |
Two limits worth knowing before you judge the output: runtimes expose very different data (some publish no cost at all — the matrix says which, per runtime), and observing an action is not the same as being able to block it (which controls are real, per runtime).
Works with 33 agent runtimes
Free in the open source app: 🦞 OpenClaw · 🟩 NVIDIA NemoClaw · 🪿 Goose · ◈ Qwen Code
On a paid plan: ◆ Claude Code · Cursor · 🐙 GitHub Copilot · ⬡ OpenAI Codex · ♊ Gemini CLI · 💗 Lovable · ⠕ Replit Agent · 🖇 Cline · 🙌 OpenHands · 🧑💼 OpenWorker · 🎭 Muse Code · 🏛️ OpenExecutive · ⠿ OpenDots · opencode · Aider · 🔗 n8n · 🅳 Devin · 🪐 Antigravity · Grok Build · 🤖 Grok Bot · ⚡ Hermes · Pi · Deep Agents · 🌙 Kimi CLI · 🐋 DeepSeek Harness · 🦾 Exo · NanoClaw · PicoClaw · QM
Every runtime gets the same dashboard. Run several at once and the header switcher re-scopes every tab to one of them.
Built your own agent on an SDK instead? The interceptor tracks its LLM calls too. See docs/SDK_TRACKING.md.
Building with a humanoid robot? The free, open-source Asimov 1 connector imports Menlo SDK recordings and provides an optional observation collector and application tracing. This support is experimental. Physical hardware qualification is pending.
What you get
- Sessions & transcripts: what each agent did, turn by turn, with replay
- Cost & tokens: per runtime, model, session and day, with anomaly flags
- Flow: live diagram of messages moving through channels, models and tools
- Brain: the reasoning and tool-call event stream as it happens
- Context blowout: window utilization sized per provider, compaction vs forced overflow, plus a per-runtime map of what we can't see (how)
- Memory & skills: the files and skills each runtime actually loaded
- Health & logs: disk, memory, error rates, rate limits, live log stream
- Alerts: budget caps, error spikes, agent-offline, routed to Slack, Discord, PagerDuty, Telegram, Email
- Approvals: pause risky tool calls before they run and approve from your phone (how)
Context blowout, and what watching costs
Two questions worth answering before you trust any agent-comparison tool.
How does it handle context-window blowout across runtimes?
A utilization percentage is only as honest as what it divides by. ClawMetry sizes the window per provider from a table you can read and PR, covering Anthropic, OpenAI, Google, xAI, DeepSeek, Kimi, Qwen, Mistral, Llama and GLM. It does not measure all 33 runtimes with one vendor's ruler. That matters: a 300K GPT-5 turn scored against Anthropic's 200K reads ">100%, blown" when it is really at 75% of GPT-5's 400K. The same ruler hides a genuinely overflowed 130K DeepSeek turn as a comfortable 65%.
Every window ships with its provenance: model_table, explicit_marker,
observed_floor, or an honest default when we don't know the model. A
gauge built on a guess never renders with the same authority as one built on
a lookup.
ClawMetry can only see compaction events on some runtimes. So
GET /api/context-coverage reports, per runtime, whether a zero means
"ran clean" or "we're blind". A 0 that actually means blind says so.
Full detail
What does the instrumentation cost?
| Path | Added to your agent | Default? |
|---|---|---|
| Session-file tailing (all 33 runtimes) | 0. Separate process, no ClawMetry code in your agent | on |
HTTP interceptor (CLAWMETRY_INTERCEPT=1) | +0.44 ms per LLM call, or 0.009% of a 5s call | off |
| Pre-tool hook gate (warm cache) | +44 ms per gated tool call, over a 36 ms interpreter floor | off |
| Enforcement proxy | +9.7 ms per LLM call | off |
Daemon host cost: 2,762 events/sec ingest, 710 bytes/event on disk (67.7 MB per 100k events), and ~12% of one core sustained on a busy install. That last number is over our own stated 5-10% budget, so it is published as a bug to chase rather than left off the page.
Measured on an Apple M2 Pro with benchmarks/overhead.py. The harness runs
each condition in a separate process, alternates their order, and refuses
to print a number when the rounds disagree on its sign. Run it on your own
machine in a minute:
pip install clawmetry && python -m benchmarks.overhead
Every path is measured, including the hook gates and the enforcement proxy, and the harness runs on Linux, macOS and Windows in CI. Two results worth knowing: the proxy costs about seven times more on Windows than on Linux, and the daemon currently sustains about 12% of one core, over our own 5-10% budget. The raw JSON, the method, and what is still unmeasured are in docs/OVERHEAD.md.
Pricing
| Plan | What it covers | Price |
|---|---|---|
| Free | OpenClaw + NVIDIA NemoClaw + Goose + Qwen Code, full dashboard, local only | $0 |
| Starter | Every other runtime above, fleet view, cloud sync | $9 per node / month |
| Pro | Starter + control and evaluation: approvals, tool-risk policies, evals, anomaly detection, cost optimizer, OTel export, tamper-evident audit log | $19 per node / month |
Annual plans, Enterprise and the current numbers live at
clawmetry.com/pricing. Self-hosted license
keys work without the cloud (clawmetry license). The exact free/paid split is
in docs/ENTITLEMENTS.md.
Your data stays on your machine
ClawMetry reads local session files and logs. No session data leaves your box
unless you run clawmetry connect — no prompts, replies, tool arguments, file
contents or log lines. When you do connect, the snapshot is end-to-end encrypted
with a key that never leaves your machine, and decrypted in your browser. If a
node has no key, the upload is skipped rather than sent in the clear, and no
server response can turn that off.
Two things do run by default before you connect, both opt-out and neither carrying session data: an anonymous install ping and a version check against PyPI. A default install also looks up your public IP once for a startup banner line. Every destination, what it carries and how to switch it off is listed in docs/EGRESS.md; self-hosted, repointed and air-gapped installs make no discretionary outbound calls at all.
The decryption happens in your browser, in code we serve you. That used to be
a promise; it is now something you can check. Every line that touches your key
lives in one readable file, clawmetry/static/js/cm-e2e.js,
which ships inside the wheel and is served verbatim, pinned with a Subresource
Integrity hash. To confirm the browser runs what we published:
File tree
FAQ
clawmetry is a Claude Code plugin with 2 hand-picked skills, indexed on Flowy in the Monitoring category. Install it with the command on its page. It includes clawmetry, agent-kill-switch. Its skills do not fire on their own yet. Request auto-invocation to have Flowy route them as you prompt. Free and open source.
- What is clawmetry?
- An agent can make a hundred tool calls without making progress. ClawMetry reads the session files your coding agents already write, and puts the timeline, the tool calls and whatever token and cost data the runtime exposes into one view — so you can tell a
- How do I install clawmetry?
- Run these in Claude Code: npx -y skills add vivekchand/clawmetry --agent claude-code. Then prompt normally.
- Does clawmetry auto-invoke its skills?
- Not yet. It is indexed on Flowy as a plain plugin. Request auto-invocation on its page and Flowy will route its skills for you as you prompt.
- Is clawmetry free?
- Yes. Flowy is free and open source, with nothing gated. You can read every skill in full before you install.
Is this plugin yours?
Claim it with GitHubSubmit a pluginPromote it