Quant Garage
Trade like a pro. Without the terminal.
View the full landing page →
Quant and equity research tools that run inside Claude, or behind your
own UI. You ask Claude "preview NVDA earnings" or "screen for momentum
names that pulled back this week" and you get back what a professional
analyst would write at 6am, with the supporting numbers and citations
to the API calls underneath.
Or you skip Claude entirely. pip install quant-garage and call the
same tool from your own code. Every skill is an importable Python
function that returns JSON, so it drops straight into a Jupyter
notebook, a research dashboard, a Slack alert, a cron job. Both paths
work because every skill ships the same compute as two layers: the
JSON contract for developers and a rendered note, table, stream, or
report for humans.
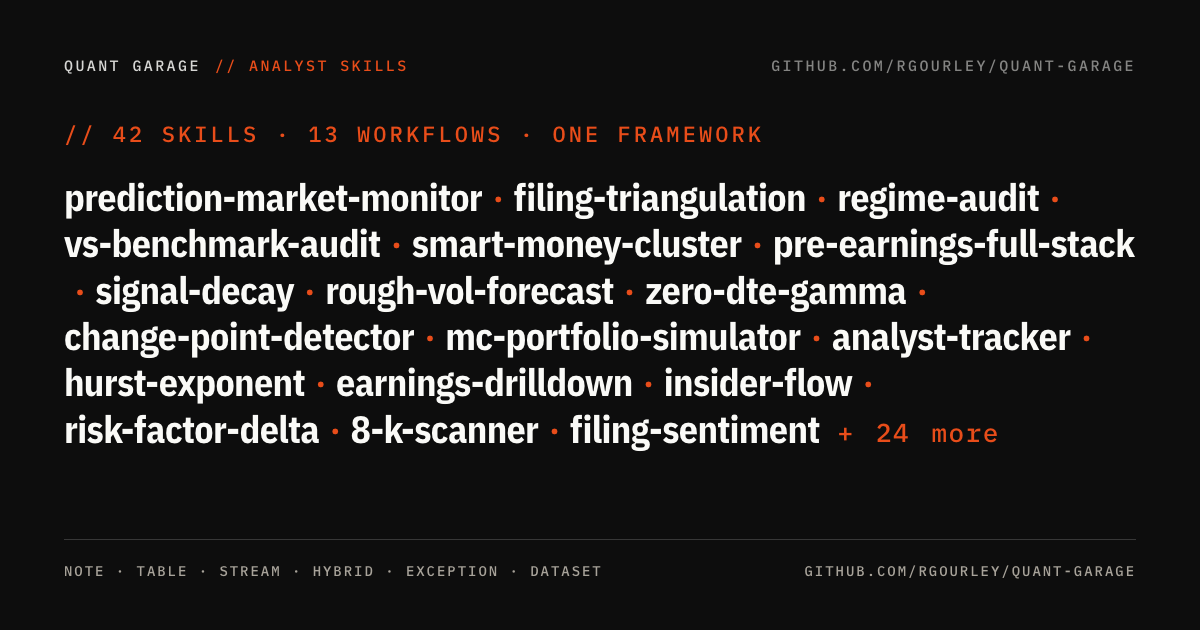
Forty-two primitives plus thirteen one-command workflows. One
framework. Built in the garage, not the trading floor.
Needs a Massive API key. Free Basic
tier runs twenty-one of the primitives plus most workflows end-to-end;
$29/month Stocks Starter opens thirty-nine of the forty-two primitives
and every workflow. One primitive (prediction-market-monitor) needs
no Massive key at all — it uses Kalshi's public read-only API.
Feedback welcome. Found a bug or have an idea? Open an
issue or send a
pull request.
What the collection does
Each primitive is useful on its own. The point of having forty-two that
share data, methodology, and audit trail is that they chain. The
eight workflows show what that chaining looks like when someone
wires the pieces together for a specific cadence.
Tuesday morning, you're long NVDA into Thursday's print.
earnings-drilldown shows the implied move is rich vs the 8-quarter
realized. valuation-sanity-check --mc puts the current price at the
78th percentile of peer-driven fair values. You like the setup but
want to size honestly. position-sizer puts NVDA at 8% under
vol-target given the 48% realized vol. You execute. portfolio-mark
walks the snapshot fallback chain; slippage-cost flags one fill that
crossed the spread. End of day: risk-report shows NVDA now drives
35% of portfolio variance.
One repo, one Massive key, one methodology.
The research side has the same shape. universe-builder screens for
momentum pullbacks; factor-research confirms which factors are
working this regime; news-scanner checks for catalysts on the
survivors; event-study measures the abnormal return around each
catalyst. You get from "what should I look at?" to "here's the regime
context and the abnormal-return distribution" in a single workflow.
Each tool plugs into the same quant_garage/ core: same client, same
timezone handling, same audit-trail format, same significance
thresholds.
The idea
Every number in this repo cites a live API call. Every take is
computed from actual readings. Every peer set carries its sample
size. When the data is thin, the tool says so instead of guessing.
That's the whole difference between a research tool and a chatbot
with a market-data plugin. The tools refuse to fabricate when the
data isn't there, and they surface the endpoint and timestamp for
each figure so you can retrace the reasoning.
The methodology references inside each skill folder are where the
IP lives: statistical methods, sample-size rules, base rates, edge
cases, honest caveats about what the take does and doesn't prove.
The Massive API provides the inputs. Everything else is workflow.
LLMs and agents work better on top of this surface than under it.
Ask Claude Code "review my book" and it invokes the composite; ask
any tool-use LLM and it consumes the same JSON. The dual layer
means humans read a briefing, agents read a schema, both are anchored
to the same live citation trail.
Who this is for
Four honest audiences.
Retail investors with a real book. $50K to a few million. You
make informed decisions, you don't day-trade, you don't have a
Bloomberg terminal, and you want sell-side-quality output on the
positions you actually hold. The workflows above (portfolio-review,
weekly-brief, preflight-trade) were built for this exact use pattern.
Fintech and market-data developers. You're building on top of
Massive (or considering it) and you need reference tooling that
shows what a serious integration looks like. Every skill is a
working data layer with source-cited outputs, retry logic, and
proper fallback chains. Fork it, adapt it, ship it.
LLM and agent developers. You're building finance-adjacent
agents that need tool-use with real citations, not fabricated
numbers. Every run() returns JSON matching a schema; every skill
is discoverable as a Claude Code skill under skills/. The dual-
layer contract is designed for exactly this use case.
Analysts and PMs, as supplementary tooling. You have Bloomberg
or Factset. You don't need this to replace them. You do need it
for the scriptable workflows the terminal is bad at: batch a
watchlist scan, feed the output into a Slack channel, run a
sanity check that's reproducible and citation-anchored.
Not for: people looking for a trading system. These tools
encode analyst workflow, not strategy. The takes are pattern-
matchers grounded in methodology; they aren't a signal engine. If
you want production alpha, you build on top of this.
Thirteen one-command workflows
Start here. Workflows are chains of the 26 building-block tools
below, wired for specific cadences. Each takes a watchlist or a
ticker (or nothing, for macro-only reads) and returns a single
briefing with a headline block up top and the full per-tool detail
below. If you only try one thing in this repo, try one of these.
portfolio-review
The full book review in one call. Chains eight sub-skills: market-
regime, sector-rotation-signal, historical-analog-finder, risk-report,
earnings-blackout, macro-event-calendar, corporate-actions-scanner,
portfolio-rebalancer. Headline block distills each into one line:
regime, rotation theme, 90-day forward SPY distribution, portfolio
vol plus top variance contributor, next earnings, next macro, top
8-K, rebalance verdict. Built after a live review missed an ALLO
public offering (87.5M shares, 34% dilution) because the workflow
was run manually and one tool was skipped. Now the workflow is one
command that doesn't skip.
weekly-brief
Sunday-night prep. Watchlist-focused, not position-focused. market-
regime, sector-rotation-signal, macro-event-calendar (7-day window),
earnings-blackout (7-day window). The Sunday briefing that frames the
week: what's the tape, what's rotating, what prints, what macro
matters.
morning-brief
60-second daily open. market-regime, macro-event-calendar (today +
tomorrow), news-scanner (last N per watchlist ticker). Sharp
counterpart to weekly-brief: shorter horizon, news-focused. Cron
this at 8am for a briefing before you open the trading window.
preflight-trade
Before you hit execute. Takes a ticker plus intended action (buy,
sell, add, reduce, exit). Chains technical-briefing, earnings-
blackout (14d), news-scanner (last N), corporate-actions-scanner
(90d). Returns a deterministic verdict (go, wait, review) plus red
and green flag lists. Not a recommendation to trade or not trade.
A structured "is now obviously a bad time" gate.
earnings-week-prep
For weeks where four of your names print in five days. earnings-
blackout on the watchlist to find who prints, then earnings-drilldown
plus technical-briefing for the top-N imminent prints. The Sunday-
night briefing before a heavy earnings week.
historical-comparison
Twin decision-support. event-study on the specific event plus
historical-analog-finder on the market regime. Both anchors together
so you're not relying on one. Analog-only mode for when you don't
have a specific event to study.
scan-and-frame
Regime-framed idea generation. market-regime for context, universe-
builder for candidates, relative-strength to rank the top N. Optional
factor-research pass for factor context (heavy — off by default).
Discovery-mode, not position-mode.
stock-one-pager
Retail-tier single-name card. technical-briefing plus earnings-
blackout plus market-regime, translated into plain language. The
thing to read before you buy something you saw on social. Every
claim is gated to what the data actually says; nothing is templated.
Use cases, mapped to workflows
Concrete situations, mapped to the workflow that solves them.
For the 42 individual primitives (compose your own workflow), scroll down.
The 46 building-block tools, with real use cases
The workflows above are chains of these. If you're building your
own workflow or agent, this is the shelf of primitives to compose
from. Each is a standalone run() -> dict with a rendered layer
for humans and a JSON layer for downstream code.
Earnings work
earnings-drilldown
You're long NVDA into Thursday's print. Trim, hold, or fade the
straddle? Run the tool. You get the implied move vs the 8-quarter
realized average, the post-earnings drift t-stat conditional on the
reaction direction, and which semis trade with NVDA on print days.
Output reads like a sell-side morning note: bold take at the top,
supporting numbers below.
event-study
You want to measure abnormal returns around any event class:
earnings, dividend changes, large volume spikes. Single event for
one ticker (gets you a note), the same event across many tickers
(cross-section table), or all events in a window (aggregate stats
with t-stats). Last month's run on mega-cap tech Q1 prints surfaced
that the cross-section average is negative despite all five beating
on EPS. Guidance is dominating headlines this regime.
earnings-blackout
You're running a watchlist and want a 30-second pre-trade hygiene
check: which names print this week, which printed yesterday, which
are clear. Run the tool. It returns each ticker bucketed into
blackout-imminent (0-3 days forward), blackout-soon (4-7),
just-printed (0-3 past), or clear, with the date, consensus EPS

 @rgourley