
Debugging
Plugin
debugging-code
Sets breakpoints, steps, and evaluates expressions via DAP across Python, TypeScript, JavaScript, Node, Rust, and C++. It fires when you need multi-language debugging on Linux or in GitHub Actions.

Plugin Signal43/100Fair
maintained31
capable14
documented100
adopted54
Install on Claude Code
> /plugin marketplace add almogbaku/debug-skill> /plugin install debugging-code@debug-skill-marketplace
Stats
327
Stars
27
Forks
Maintained
Maintenance
Go
Language
MIT
License
5mo ago
Last commit
6mo ago
Created
Repo: almogbaku/debug-skill
What's inside
README
AI coding agents (Claude Code, Codex, Opencode, Cursor) are stuck with print statements and guesswork. debug-skill
gives them what human developers have: a real debugger they can actually use. It ships two things:
- A Claude Code skill — teaches Claude how to debug: when to set breakpoints, how to step through code, how to inspect state
- The
dapCLI — a stateless CLI wrapper around the Debug Adapter Protocol so any agent can drive a real debugger from Bash
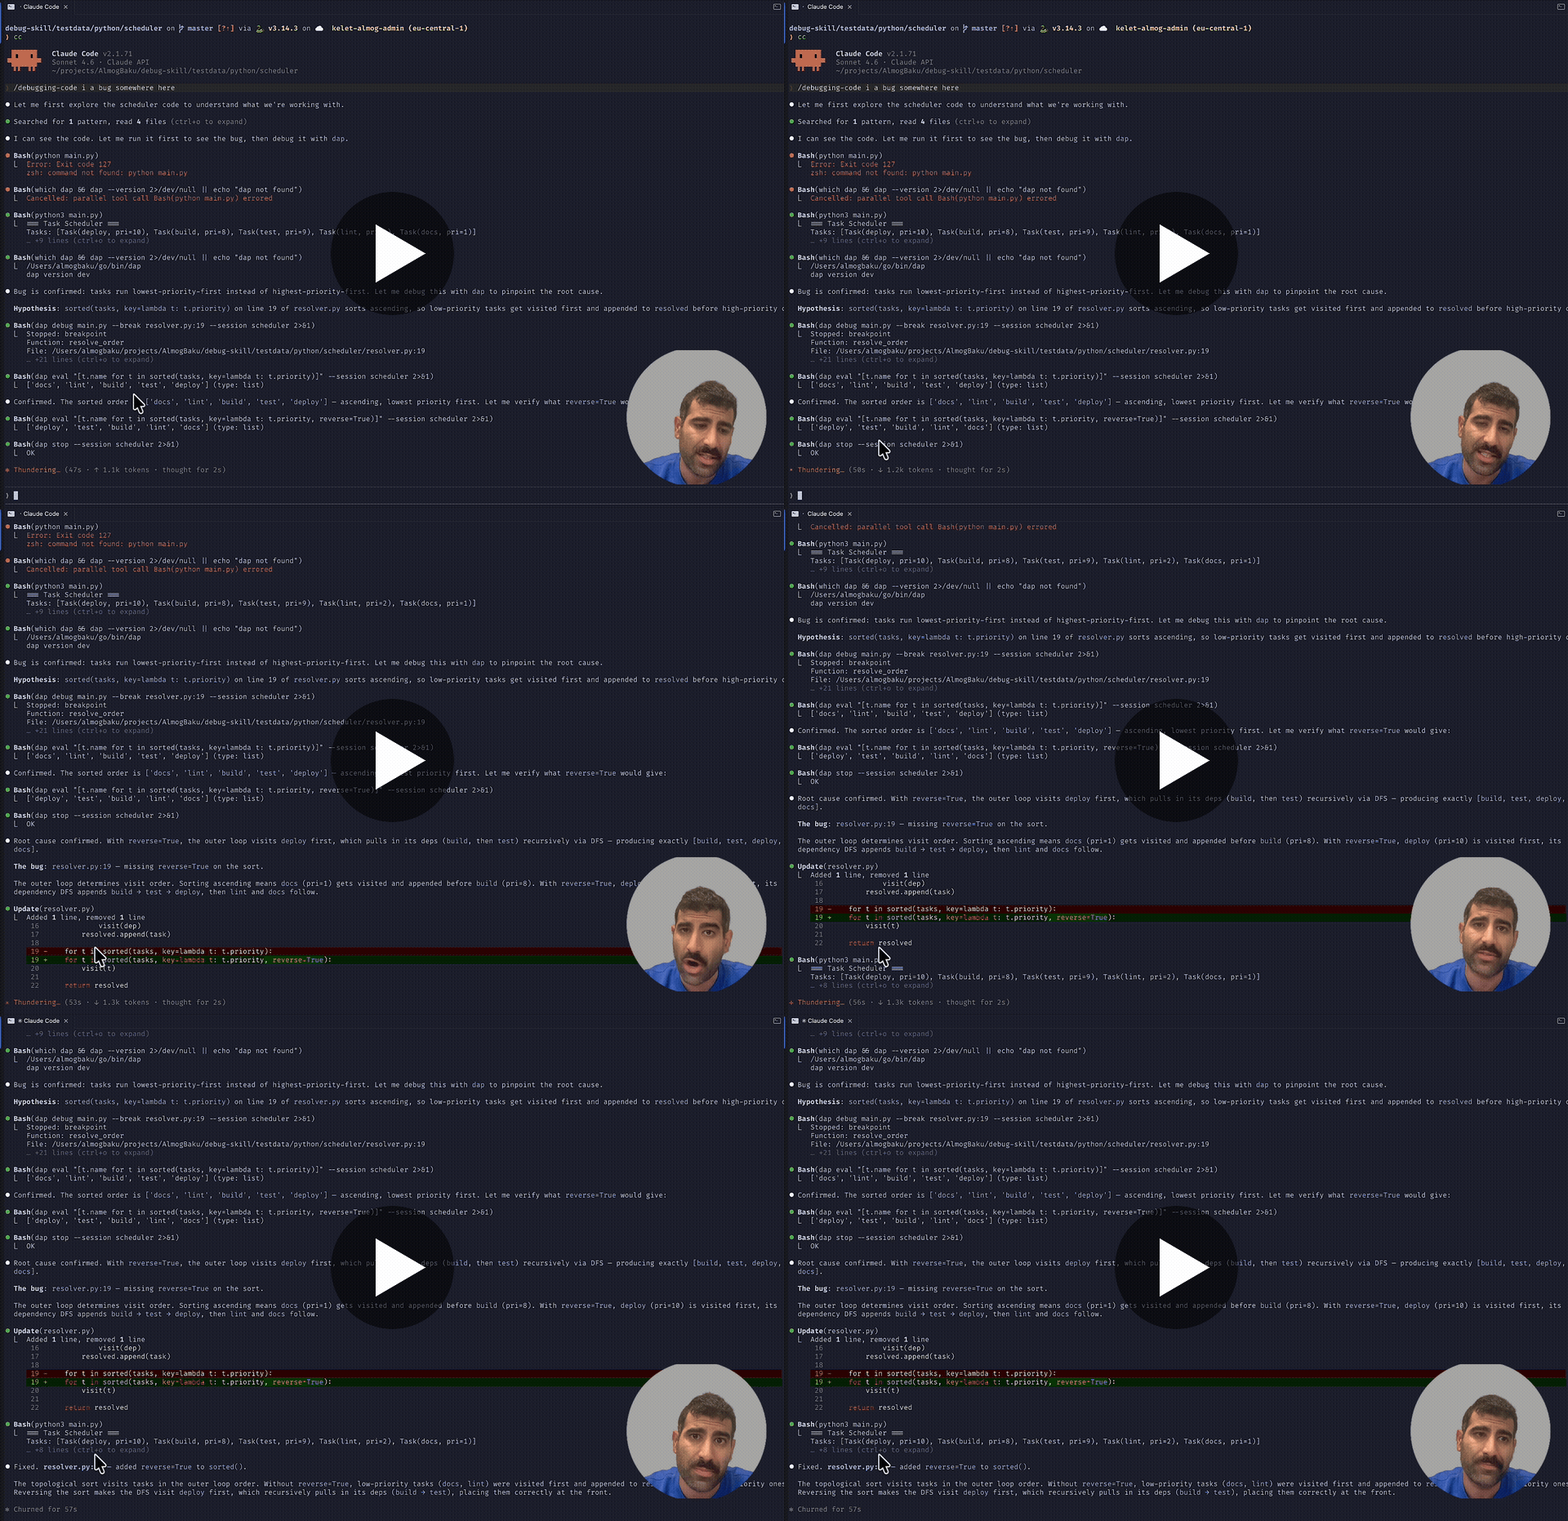
Demo
The Skill
Install the skill, and Claude debugs your code the way you would — not with print statements.
The debugging-code skill gives Claude structured knowledge of the debugging workflow: setting breakpoints, stepping
through execution, inspecting locals and the call stack, evaluating expressions mid-run. It uses the dap CLI as its
tool.
Install for Claude Code
Via the plugin marketplace — no manual setup needed:
/plugin marketplace add AlmogBaku/debug-skill
/plugin install debugging-code@debug-skill-marketplace
Install for other agents
Via skills.sh — works with Cursor, GitHub Copilot, Windsurf, Cline, and 20+ more agents:
npx skills add AlmogBaku/debug-skill
# or: bunx skills add AlmogBaku/debug-skill
Or manually copy skills/debugging-code/ into your agent's skills.
The dap CLI
dap wraps the Debug Adapter Protocol behind simple, stateless CLI commands. A background daemon holds the session; the
CLI sends one command and gets back the full context — no interactive terminal required.
Install
# One-liner (Linux & macOS)
bash <(curl -fsSL https://raw.githubusercontent.com/AlmogBaku/debug-skill/master/skills/debugging-code/scripts/install-dap.sh)
From Homebrew (for macOS):
brew install AlmogBaku/tap/dap
From sources:
# Go install
go install github.com/AlmogBaku/debug-skill/cmd/dap@latest
Or download a pre-built binary from the releases page.
Quick Start
dap debug app.py --break app.py:42   # start, stop at breakpoint
dap eval "len(items)"                # inspect a value
dap inspect data --depth 2           # expand nested objects
dap step                             # step over
dap continue                         # next breakpoint
dap continue --to app.py:50          # run to specific line
dap pause                            # interrupt if hanging
dap restart                          # re-run, preserving breakpoint changes
dap stop                             # end session
Execution commands (debug, continue, step) return full context automatically: current location, surrounding source, local variables, call stack,
and program output. No follow-up calls needed.
Usage Examples
# Python
dap debug app.py --break app.py:42

# Go
dap debug main.go --break main.go:15

# Node.js / TypeScript
dap debug server.js --break server.js:10

# Rust / C / C++
dap debug hello.rs --break hello.rs:4

# Attach to a remote debugger (e.g. debugpy in a container)
dap debug --attach container:5678 --backend debugpy --break handler.py:20

# Attach to a running process by PID
dap debug --pid 12345 --backend debugpy

# Pass arguments to the program
dap debug app.py --break app.py:10 -- --config prod.yaml --verbose
Commands
| Command | Description |
|---|---|
dap debug <script> | Start debugging (local or --attach host:port or --pid PID) |
dap stop | End session |
dap step [in|out|over] | Step (default: over) |
dap continue | Resume execution (--to file:line for temp breakpoint) |
dap context [--frame N] | Re-fetch current state |
dap eval <expr> [--frame N] | Evaluate expression in current frame |
dap inspect <var> [--depth N] | Inspect variable (expand nested objects) |
dap output | Drain buffered stdout/stderr since last stop |
dap pause | Pause a running program |
dap restart | Restart session, preserving breakpoint changes |
dap threads | List all threads |
dap thread <id> | Switch to a different thread |
dap break list|add|remove|clear | Manage breakpoints mid-session |
Global flags: --json (machine-readable output), --session <name> (named sessions), --socket <path> (custom
socket path), --context-lines <int> (lines of source context)
Supported Languages
| Language | Backend | Auto-detected |
|---|---|---|
| Python | debugpy | yes |
| Go | dlv (Delve) | yes |
| Node.js/TypeScript | js-debug | yes |
| Rust / C / C++ | lldb-dap | yes |
Backend is inferred from the file extension. Override with --backend <name>.
How It Works
dap <cmd> → Unix socket → Daemon → DAP protocol → debugpy / dlv / js-debug / lldb-dap → your program
The daemon starts automatically on dap debug and shuts down on dap stop (or after 10 min idle). It's invisible — you
never manage it directly.
Multi-Session
Multiple agents can debug independently with named sessions:
dap debug app.py  --session agent1 --break app.py:10
dap debug main.go --session agent2 --break main.go:8

dap stop --session agent1   # stops agent1 only
Each session has its own daemon and socket. Omit --session to use the default session.
Contributing
PRs and issues welcome. See claudedocs/ for architecture details and CLAUDE.md for code conventions.
Support the Project
If debug-skill saves you from a painful debugging session, consider starring the repo — it helps others find it and keeps the project going.
License
MIT
File tree
FAQ
debugging-code is a Claude Code plugin with 1 hand-picked skill for debugging work, indexed on Flowy. Install it with the command on its page. It includes debugging-code. Its skills do not fire on their own yet. Request auto-invocation to have Flowy route them as you prompt. Free and open source.
- What is debugging-code?
- Sets breakpoints, steps, and evaluates expressions via DAP across Python, TypeScript, JavaScript, Node, Rust, and C++. It fires when you need multi-language debugging on Linux or in GitHub Actions.
- How do I install debugging-code?
- Run these in Claude Code: /plugin marketplace add almogbaku/debug-skill then /plugin install debugging-code@debug-skill-marketplace. Then prompt normally.
- Does debugging-code auto-invoke its skills?
- Not yet. It is indexed on Flowy as a plain plugin. Request auto-invocation on its page and Flowy will route its skills for you as you prompt.
- Is debugging-code free?
- Yes. Flowy is free and open source, with nothing gated. You can read every skill in full before you install.
Is this plugin yours?
Claim it with GitHubSubmit a pluginPromote it